
基于热红外成像的小麦条锈病早期检测
[姚志凤1, 2  , 何东健
, 何东健1, 2, * , 雷雨1, 2 ]
, 何东健, 雷雨|
|


由条形柄锈菌引起的小麦条锈病是一种世界性范围内普遍流行的重大病害, 实现其早期检测对病害的有效防控与小麦的安全生产具有重要意义。 旨在实验室环境下分析小麦接种条锈病菌后16天的热红外图像与叶片温度变化, 研究热红外成像技术用于小麦条锈病早期检测的可行性。 实验发现, 随着接种天数的增加, 接种病害的小麦植株较健康小麦, 叶片的平均温度会逐渐降低, 叶片间的最大温差会不断加大。 接种后第6天, 热红外成像技术可观测到小麦条锈病病斑, 较肉眼观察提前了4天。 接种后第16天, 接种叶片的平均温度比健康叶片低2.5 ℃, 最大温差比健康叶片高2.28 ℃。 同时, 通过对健康、 发病以及潜伏期的小麦叶片的显微结构分析, 发现条锈病孢子入侵叶片, 使细胞结构破环, 气孔导度增大, 蒸腾作用加剧, 从而导致叶片表面温度降低。 可见, 热红外成像技术可以对小麦条锈病进行早期检测。
Biography: YAO Zhi-feng, (1984—), female, doctoral candidate, College of Mechanical and Electronic Engineering, Northwest A&F University e-mail: yzf8466@163.com
Wheat stripe rust, caused by Puccinia striiformis f. sp. tritici, is one of the most destructive diseases causing severe decreases in wheat yield. Early detection of wheat stripe rust before symptom appearance is of great significance for developing effective control strategies and taking timely management measures to ensure high and stable yield of wheat. The objective of this study is to investigate the possibility of thermal infrared imaging technology used for early detection of wheat stripe rust by assessing the temperature changes of normal and infected wheat leaves in a pot experiment under controlled conditions. Four pots of wheat plants were subjected to artificial inoculation with Puccinia striiformis once a day, lasting for 16 days, in an artificial climate chamber. Meanwhile, healthy wheat plants were chosen as the normal control. Thermal infrared images and data on leaf temperature of all the normal and infected wheat leaves were collected 16 days after inoculation (dpi) by using an infrared thermography. The results revealed that with the increasing of days after inoculation, the divergence in the average temperature and maximum temperature difference (MTD) between infected and healthy wheat leaves gradually increases. The infected wheat leaves can be distinguished from healthy ones 6 days after inoculation using infrared thermal imaging, that is, at least 4 days before visible symptoms appearance. At 16 dpi, the average temperature of the inoculated wheat leaves was 2.5 ℃ lower than that of healthy ones, and the MTD of the inoculated leaves was 2.28 ℃ larger than that of healthy ones. Fungal development was also assessed microscopically. It was found through microscopic observation and analysis that stripe rust ( Puccinia striiformis) infection caused changes in the integrity of the epidermal cells, the structure of chloroplasts, as well as stomatal conductance and leaf transpiration rate involved in inducing defense. A decrease in leaf surface temperature after the infection was observed as a thermal signature of early infection of disease after successful germination, penetration and reproduction of urediniospores. Thus, thermal infrared imaging has great potential for early detection of wheat stripe rust, with noninvasive monitoring and direct visualization characteristics.
Wheat stripe rust, caused by Puccinia striiformis f. sp. tritici, is one of the most destructive diseases of wheat worldwide, with characteristics of high prevalence, strong explosion and heavy damage occurrence range, etc. This disease is widespread in eastern and central Asia, western Europe and the Pacific coast of North America as well as Oceania, northern and eastern Africa and South America[1]. China is the largest epidemic area of wheat stripe rust in the world. Wheat yield can be reduced by 20%~30% during stripe rust epidemic years, and can be reduced by more than 50%, or even total loss, during an extreme epidemic year in China[2]. The whole infection process of Puccinia striiformis can be divided into phases of contact, invasion, incubation and incidence. The spread of pathogens in the subject cannot be observed by the naked eye during the incubation period. However, wheat stripe rust will easily become epidemic over a wide area under suitable conditions once it enters the incidence phase. Therefore, if a method could rapidly and accurately diagnose stripe rust during the incubation period, appropriate prevention and control measures could be taken before the disease spreads over a large area. In addition, early detection of the disease can also reduce the pesticide dosage and environmental pollution, apart from ensuring the safe quality of wheat and human health. Therefore, it is of great significance to conduct research on the early detection of wheat stripe rust.
Common methods for the detection of plant diseases include visual plant disease estimation by human raters, microscopic evaluation of morphology features to identify pathogens, as well as hyperspectral remote sensing technology[3] and molecular biology techniques[4]. But these time-consuming methods demand experienced individuals with well-developed skills in disease detection and are thus subject to human bias. Previous studies[5, 6] showed that when wheat was infected and stressed by pathogens, a series of pathological changes in the infected tissue would occur, such as photosynthesis, transpiration and stomatal conductance, leading to blade temperature change. Therefore, early detection of wheat stripe rust can be carried out by detecting the change in the wheat leaf temperature.
Thermal imaging is a technique that converts the invisible radiation pattern of an object into visible images for feature extraction and analysis. As a noninvasive, nondestructive, nonpolluting, and rapid analysis technology, thermal imaging is widely applied in various fields, such as aerospace engineering, civil engineering, medicine and agriculture[7]. In agriculture, thermal imaging has wide application in predicting soil water status, detecting drought or nutrition stress of plants, and estimating yield of fruits in the orchard[8, 9, 10]. Recently, thermal imaging has been used to find correlations between temperature and transpiration in various plants infected with fungal pathogens. Based on thermal imaging, Yasser Mahmoud Awad[11] found that mean temperature of wheat leaf changed from 0.37 ℃ one hour after infection to 0.78 ℃ at 21 days after infection with the powdery mildew pathogen. Kim et al.[12] investigated the spatial patterns for temperature distribution on crape myrtle leaves infested with sooty mold using a digital infrared thermal imaging camera. Al Masri et al.[13] noted that thermography was useful to differentiate among infection scenarios and may be applied in breeding for Fusarium head blight resistance. Xiaolong Li et al.[14] proposed a method for early detection of wheat diseases based on thermal infrared imaging since the Puccinia striiformis infection could result in changes of transpiration rate of wheat leaves and thus result in changes in leaf temperature. All these studies have provided good research ideas and foundations for our further research.
The objective of this study was to investigate the temperature changes in normal and infected wheat leaves at different stages of the infection process and to evaluate the suitability of infrared thermography as a rapid, non-destructive technique for presymptomatic detection of stress related to stripe rust.
Wheat Mingxian 169, which is highly susceptible to P. striiformis f. sp. tritici, were grown in plastic pots (7× 7× 8 cm) in a rust-free growth chamber with temperature of (16± 3) ℃ and photoperiod of 16 h of light and 8 h of darkness[15] in the State Key Laboratory of Crop Stress Biology for Arid Areas and College of Plant Protection, Northwest A& F University, China. Previous investigations using infrared thermography have demonstrated that environmental changes (such as temperature, humidity, illumination, and airflow speed) greatly affect leaf temperature[16]. The daily inoculation method was selected to reduce the effect of environmental changes on thermography. Four pots (15~20 wheat plants per pot) were inoculated every day for 16 days in the following way: Firstly, wheat leaves were gently rubbed with a clean moistened finger to remove the waxy layer from the leaf surface at 12 days from sowing. Next, the urediniospores of the pathogen on naturally infected leaves (from living tissues) were collected and used to artificially infect the first leaves of seedlings. Finally, the inoculated plants were covered with wet polyethylene bags to maintain 100% relative humidity and kept for 24 h at 10 ℃ in a dark chamber. Immediately after incubation, plants were transferred to a clean growth chamber set to a diurnal cycle of 16 ℃ for the 16-h light period and 13 ℃ for the 8-h dark period. Plants were assessed daily for stripe rust development by visual rating. On the 16th day, a total of 64 pots of wheat samples, with different incubation days and disease progression, were obtained. Meanwhile, 4 pots of healthy wheat seedlings without inoculation were selected as control.
Thermal images of wheat plants were captured using an un-cooled focal plane array infra-red camera (A300, FLIR, USA) with a spectral sensitivity of 7.5 to 13.5 μ m, a geometric resolution of 1.36 mrad (320× 240 pixels) and a 25° × 18.8° field of view lens. The thermal resolution is 0.05 ℃, and the accuracy of absolute temperature measurement is less than ± 2 ℃. Throughout the entire experiment, the emissivity was set to 0.99, which is within a range for plant leaves quoted by Lindenthal M, et al.[17]. The assorted BM-IR analysis software was provided with an English interface and windows platform with a temperature analysis function for point, line and region. Colour images of the leaves were taken with commercial digital cameras (Nikon, Tokyo, Japan). At the same time, the images of cell microstructure of the wheat samples were obtained with a laboratory electron microscope (Olympus-BX53, Olympus Corp., Tokyo, Japan).
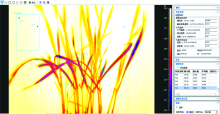
On the 16th day after inoculation, a total of 64 pots of wheat samples with different incubation days, and 4 pots of healthy wheat samples without inoculation, were removed from the artificial climate chamber and placed in the Key Laboratory of Agricultural Internet of things, Northwest Agriculture & Forestry University for an hour (room temperature of (28± 1) ℃ and relative humidity of 50%) to balance the wheat plant temperature and reduce the experimental error caused by external factors. Firstly, a digital camera was used to capture the visible light pictures of both healthy and infected leaves. Then, a thermal imager was installed at a distance of 40~50 cm from the samples in the horizontal direction to obtain the infrared thermal images under natural light. The dates of each incubation day were repeated 4 times in order to ensure the stability of data. The data were recorded in form of radiometric images and analyzed using BM-IR analysis software. To obtain the stable leag temperature values, eight irregular areas of interest (ROI) with 2 000~2 500 pixelsfor each imagewere selected (Figure 1). Since each pixel reveals individual temperature signals, the temperature of wheat leaf in each day is an average value of more than 8 000 pixel. Finally, the data were conducted statistically using SPSS 22 (SPSS Inc., Chicago, IL, USA) and analyzed by standard analysis of variance. Where a significant treatment effect was demonstrated by the ANOVA (p≤ 0.05), significant differences between means were determined with Tukey’ s test.
 | Fig.1 Screenshot of BM-IR analysis software with eight areas of interest (ROI). The air temperature was recorded from a ROI measurement cursor (4 000 pixels) in the blank area |
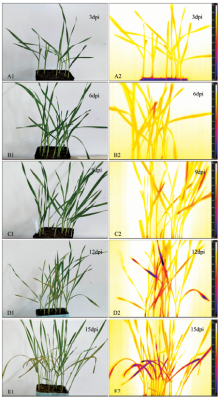
The development of inoculated wheat plants was visually investigated every day under the experimental conditions. During the first 9 days of the experiment, there was no statistically significant difference between the treated and control plants except for changes in shape and size of plants (Figure 2: A1, B1, C1). Irregular yellowish green spots on the leaf surface appeared as the first characteristic symptom of stripe rust at 10 dpi, which then developed into small spore piles at 12 dpi (Figure 2, D1) and extended to the full inoculated blades that appeared curled and atrophied at 15 dpi (Figure 2, E1).
Meanwhile, the thermal infrared images of the inoculated wheat plants were collected for comparison. The infrared thermal images of the inoculated plants gradually varied throughout the whole incubation period. An initial thermal response of wheat leaf tissue to Puccinia striiformis infection was observed as dark yellow coloration at6 dpi (Figure 2, B2). The color of the infected area deepened, and the area expanded with an increasing number of days after inoculation. The entire blade became purple at 15 dpi (Figure 2, E2). Since the inoculated leaves were only the first leaf of each plant, the newly developed leaves were not infected and remained green. Hence, one can see that the infected wheat plants without symptomatic appearance can be distinguished from healthy ones at 6 dpi using infrared thermal imagery, while detection occurs at 10 dpi using only the naked eye. Stripe rust infection could be detected 4 days earlier by using thermography instead of visual inspection.
 | Fig.2 Comparison between photographs and thermographs of attached wheat seedlings from suripe rust past 3, 6, 9, 12 and 15 days of incubation First thermal effects of stripe rust became detectable at 6 dpi; similarly, areas of low leaf temperature preceded visible symptoms in later stages of leaf colonization. Left: RGB reflectance, right: thermo-images |
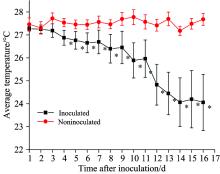
The average temperature changes in healthy and infected wheat blades for 16 consecutive days are shown in Figure 3. It can be seen that the average temperature of healthy blades fluctuated slightly during the entire detection period. In contrast, the average temperature of the inoculated blades decreased noticeably. With the increasing of days after inoculation, the divergence of the average temperature between inoculated blades and healthy ones gradually increased. The average temperature of the inoculated blades was 2.22 ℃ lower than that of healthy ones at 16 dpi.
 | Fig.3 Effect of Puccinia striiformis infection on average leaf temperature of wheat plants during 16 days past inoculation. Asterisks indicate a significant difference at p< 0.05 level of average temperature for healthy wheat plants and for that of wheat plants in the incubation period on different day after inoculation with Puccinia striiformis. Error bars indicate standard deviations |
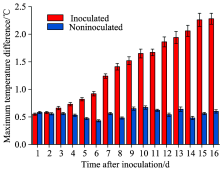
The maximum temperature difference (MTD) between the maximum and minimum temperatures of total leaf areas during the whole detected period are shown in Figure 4. The MTD of non-inoculated leaves was almost constant during the experiment and stayed within a range of 0.5 ℃. The temperature distribution was still indistinguishable from that of inoculated leaves at 3 dpi. However, at 4 dpi, the MTD of the infected leaves was significantly higher (+0.3 ℃) than that of healthy leaves. With the development of stripe rust symptoms, MTD increased by more than 2.3 ℃ at 16 dpi, which was approximately 1.8 ℃ higher than that of non-inoculated control leaves. The result of the variance analysis showed that the average temperature and MTD of the inoculated wheat plants and of the healthy plants appeared to have a significant difference at 16 dpi (p< 0.05): the average temperature of the inoculated plants was 2.22 ℃ lower than that of healthy plants, and MTD was 1.8 ℃ larger than that of healthy plants. Therefore, the infection of Puccinia striiformis could be detected at 4 dpi using temperature data analysis, 6 days earlier than the visual rating method.
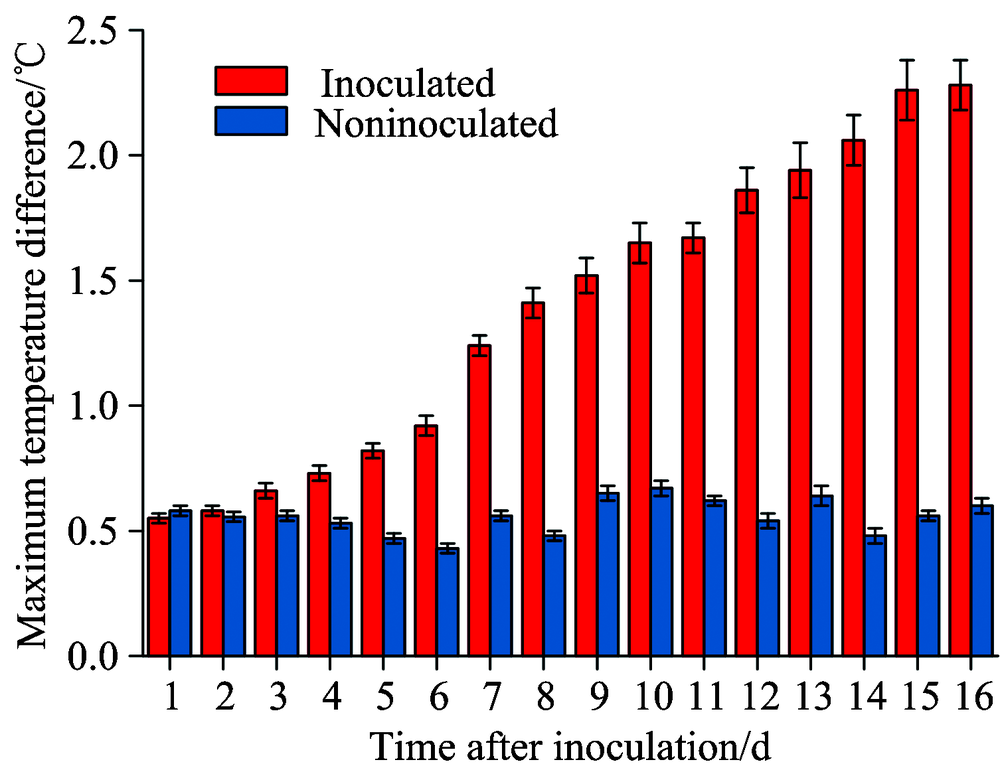 | Fig.4 Effect of Puccinia striiformis f. sp. tritici infection on maximum temperature difference (MTD) within the entire wheat leaf during the consecutive 16 dayspast inoculation. Significant differences between treatments are indicated by different letters following ANOVA |
Three samples were analyzed with the microscopic images in the experiment, which were as follows: the infected blades at 8 dpi, the disease blades at 15 dpi and healthy blades as control. Figure 5 depicted the reaction of wheat tissue during different stages of stripe rust development in microscopic sections of primary infection sites. It could be seen that the healthy ones had a complete structure of crosscut sections, a compact structure and plentiful epidermal cells, and the chloroplasts were attached around the cell wall (Figure 5: A1, A2, A3). When the blades were infected, the Puccinia striiformis would break through the protection of the epidermal cells to destroy the internal structure. Mesophyll cells were modified, and the number of chloroplasts was reduced considerably at 8 dpi (Figure 5: B1, B2, B3). For the diseased blades (15 dpi), whether the epidermis cells, mesophyll cells or chloroplast were seriously damaged. The pathogens invaded each tissue of the blade and accumulated to create a large number of summer spore banks or spore beds (Figure 5: C1, C2, C3).
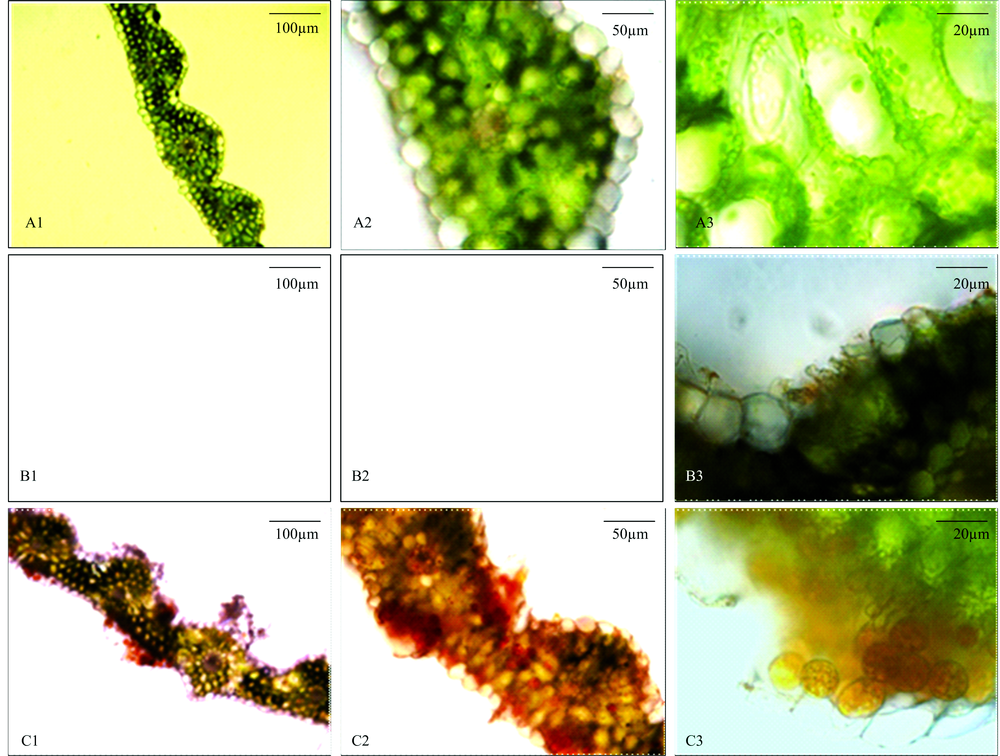 | Fig.5 Sections of wheat leaf tissue infected with Puccinia striiformis f. sp. Tritici during different stages of pathogen development A: healthy tissue; B: tissue at the infection site at 8 dpi without macroscopic symptoms but with the epidermis layer destructed; C: chlorotic tissue with hyphae of Puccinia striiformis. |
It is well known that the temperature of leaves has a negative linear correlation with leaf transpiration by stomata. And transpiration rate could be influenced by pathogens which infect plants by penetrating stomata and affecting stomatal conductance. In the initial stage of infection by stripe rust, Puccinia striiformis form a primary germ tube to penetrate through the leaf surface and produce the substomatal vesicle, an infection hypha and a haustorial mother cell in the subcutaneous tissue.However, as an obligate biotrophic pathogen, the stripe rust pathogen consumes nutrients from living host cells for survival and reproduction and, therefore, it does not lead to the death of the host plant. The previous studie[18] shows that when pathogen infects the wheat blades, the metabolism of invaded parts will be affected, the stomata conductance will increase, and the transpiration will also be aggravated, so that the temperature of the invaded parts of blades is lower than that of healthy parts, which is confirmed in this study. With the increase in the infected intensity influence of Puccinia striiformis on the transpiration of blades, the blade temperature decreases continuously, and the maximum temperature difference of the blades increases but without any obvious visible symptoms. The reaction between pathogen and wheat leaves occurred 10 days after the artificial infection of stripe rust pathogen, leading to the appearance of fungal growth as a disease symptom on leaves. At the late stage of infection, the pathogens invaded each tissue of the blade and accumulated to create a large number of spore banks or spore beds, causing a large amount of water transpiration and leading to the formation of yellowish leaves, as shown in Figure 5.
Faye et al.[16]suggested that environmental conditions could affect the leaf surface temperature, thereby affecting the early detection of pathogen infection using infrared thermal imaging technology. In this study, the wheat plants were cultivated within an artificial climate chamber, and infrared thermal images and temperature data were collected at room temperature. Thus, environmental disturbances by external factors was minimal. Meanwhile, in order to eliminate the disturbance caused by environmental changes over time, the wheat plants were inoculated in the same way every day. On the sixteenth day after inoculation, the infrared thermal images and temperature data of all the samples were collected at the same place and the same time. These methods reduced the error caused by environmental changes, and the experimental results were good. However, the environment of wheat plants in the field is relatively complex and variable. Therefore, how to perform rapid and accurate early detection of wheat stripe rust in the breeding field by thermal imaging techniques constitutes the theme of our following research.
A novel strategy for early nondestructive detection of wheat stripe rust was proposed using infrared thermal imaging combined with statistical analysis and microscopic observation. The temperature changes of normal and infected wheat leaves were investigated and compared in a pot experiment under controlled conditions. The results indicated that the infected wheat plants without symptomatic appearance could be discriminated from the healthy ones at 6 dpi by thermography, that is, at least 4 days before visible symptoms appeared. The average temperature and MTD of healthy wheat blades did not change significantly during the whole detected period. However, the average temperature manifested a gradual downward trend, and the MTD of inoculated wheat gradually increased with an increasing number of days after inoculation. The decrease in leaf surface temperature after the infection was observed as a thermal signature of early infection of disease by microscopic analysis. This study demonstrates that infrared thermal imaging is feasible for the early detection of wheat stripe rust, which provides a reliable method for the rapid, nondestructive and online detection of wheat stripe rust.
The authors have declared that no competing interests exist.
| [1] |
|
| [2] |
|
| [3] |
|
| [4] |
|
| [5] |
|
| [6] |
|
| [7] |
|
| [8] |
|
| [9] |
|
| [10] |
|
| [11] |
|
| [12] |
|
| [13] |
|
| [14] |
|
| [15] |
|
| [16] |
|
| [17] |
|
| [18] |
|