引用本文
I Rehan, K Rehan, S Sultana, R Muhammad. Laser Induced Breakdown Spectroscopy for Comparative Quantitative Analysis of Betel Leaves from Pakistan[J]. Spectroscopy and Spectral Analysis, 2018,38(10): 3295-3302.
Doi:10.3964/j.issn.1000-0593(2018)10-3295-08
Permissions
Doi:10.3964/j.issn.1000-0593(2018)10-3295-08
Copyright©2018, 《光谱学与光谱分析》期刊社
《光谱学与光谱分析》期刊社 所有
Laser Induced Breakdown Spectroscopy for Comparative Quantitative Analysis of Betel Leaves from Pakistan

Abstract
Laser induced breakdown Spectroscopy (LIBS) was applied for the elemental analysis and exposure of the heavy metals in betel leaves in air. Pulsed Nd:YAG (1064 nm) in conjunction with a suitable detector (LIBS 2000+, Ocean Optics, Inc) having the optical resolution of 0.06 nm was used to record the emission spectra from 220 to 720 nm. Elements like Al, Ba, Ca, Cr, Cu, P, Fe, K, Mg, Mn, Na, P, S, Sr, and Zn were found to present in the samples. The relative abundances of the observed elements were calculated through standard calibration curve method, integrated intensity ratio method, and weight percentage LIBS approach. LIBS findings were validated by comparing its results with the results obtained using a typical analytical technique of Inductively Coupled plasma-optical emission spectroscopy (ICP-OES). Limit of detection (LOD) of the LIBS system was also estimated for heavy metals. The experience gain through this work implies that LIBS could be highly applicable for testing the quality and purity of food products.
Keyword:
Laser induced breakdown spectroscopy (LIBS); Spectral analysis; Inductively coupled plasma-optical emission spectrometry; Limit of detection (LOD)


Introduction
The scientific name of betel plant is piper betel. This belongs to the clan of Piperaceae i.e. the black pepper family[1]. This plant is much more popular in Pakistan. This edible leaf are widely used in countries like Bangladesh, Burma, China, India, Indonesia, Malaysia, Nepal, Philippines, South Africa, Sri Lanka, Thailand, and Pakistan[2]. Traditionally used for chewing in their natural raw circumstance along with many other ingredients like sliced areca nut, slaked lime, coriander, aniseed, clove, cardamom, sweetener, coconut Scrapings, ashes of diamond, pearl, gold and silver (Ayurvedic Preparations), jelly, pepper mint, flavouring agent, and fruit pulp[3]. According to the report of WHO (World Health Organization), frequent use of betel chewing may cause of oropharyngeal tumours that may lead to cancer[4].
In the first century of third millennium today in which we are living scientists using different techniques for analysis of the elemental composition of edibles[5]. These methods are also very helpful for monitoring pollutants in adjacent atmosphere such as soil, water and air in which vegetables, farming products and trees are in direct contact. Analysis of elemental composition of edible leaves like betel leaves can provide helpful evaluation and help for the controlled protected and healthy alimentation[6]. Many of the innovative elemental investigation techniques has been introduced in past spans such as Graphite Furnace atomic absorption spectrometry (GFAAS)[7, 8], Inductively coupled plasma mass spectrometry (ICP-MS)[9, 10], Inductively coupled plasma atomic emission spectroscopy (ICP-AES)[11], Flame atomic Absorption spectroscopy[12, 13], Flame atomic absorption spectroscopy[12, 13, 14], Laser Induced fluorescence spectroscopy (LIFS)[15, 16] and most emerging techniques of these days is laser induced breakdown spectroscopy (LIBS)[17, 18]. LIBS is highly applicable to food analysis due to its versatile investigational technique such as its multi-elemental recognition ability, real time analysis, ease of implementation, least requirement for sample preparation, high spatial resolution and remote sensing probability[19]. Additionally, every kind of material can be analysed by LIBS technique irrespective of its nature and matrix (chemical composition of element)[20]. Similarly LIBS is also capable for applications in various interplanetary investigation[21], qualitative valuations of industrial products for recycling and investigation of materials in harmful surroundings[22], classification of quartz samples[23], for determination of heavy metals in textile dyes[24], as well as for quantitative analysis of Shilajit samples[25].
The aim of present experiment was the comparative study of betel leaves available in Pakistan using LIBS. Betel leaves are commonly used for chewing together in a wrapped package of tobacco, spices, along with the mineral slaked lime. We collected the most used edible betel leaves samples from different areas available in Pakistan. The fresh betel leaves were acquired, washed and then dried in desiccators. The dried leaves were crushed to fine powder to prepare pellets and were exposed to laser light to collect emission spectra.
To estimate the abundance of the detected elements in the betel leaves samples, we used three different spectroscopic techniques based on LIBS: by standard calibration curve method, integrated intensity ratio method, and by weight percentage LIBS approach. The LIBS results were validated by comparing to the analyses performed by a more standard analytical technique of inductively coupled plasma-optical emission spectroscopy (ICP-OES). The outcomes by ICP-OES were more precise; but this method needs much time and sample preparation, while LIBS is easy and the outcome may be obtained with nominal sample preparation.
1 Methods and materials
Fresh Betel Leaves (edible) was purchased from different areas of Pakistan, where these are typically grown. We collected the most used samples of edible betel leaves and named as sample 1 (Sanchi), sample 2 (Saloon), sample 3 (Pakistani). These leaves were thoroughly scrubbed under tap water and then with distilled-deionized water. The leaves were cut into the small sections (100 g; only leaf portion) and put in a drying oven at 80~85 degree Celsius for 3 days for complete dryness. The dried samples were ground to fine particles in Aluminium (Al) Carbide mortar and dried again at 80~85 degree Celsius for 2~3 hours, cooled and kept in desiccators. From the powdered material pellets were made with a graduated, stainless steel, hand-press pellet maker. Appropriately strong pellets with smooth surfaces were obtained under these situations.
The detection set up employed to analyze betel leaves is exposed in Fig.1. Briefly, it is composed of an energy source (Laser source), a target holder, and a spectrometer (LIBS2000+, Ocean Optics, USA) with a suitable detector. A Nd:YAG pulsed laser (1 064 nm) was employed as an excitation light supply of pulse width of 5 ns. The laser pulsed energy was varied utilizing an incorporated capability in the Nd:YAG laser and is calculated via a calibrated energy meter (NOVA-QTL, P/N 1Z01507, Sr. No.56461). To be on the safe side from absorption of laser generated photon in the plasma plume at upper end of pulse energy with no compromising on Signal-to-Noise (S/N) ratio, the laser energy was optimized to be 120 mJ· pulse-1. For focusing the laser beam on the surface of target a convex lens of focal length 200 mm was used. We calibrated the spectrometer for each element of our interest there in the samples. The emissions from target
surface were observed at an angle of 900 to the laser pulse. The plasma emissions resulting from sample ablation have been collected using fibre probe attached with an optical fibre transmit it via a 10 μ m slit to a high resolution spectrometer (LIBS2000+, Ocean Optics, USA). The LIBS2000+ detection system was outfitted with five HR2000 small spectrometers that cover the spectral range 220~720 nm. All of the spectrometers have 2048 element linear CCD array having an optical resolution of about 0.06 nm. The integration time of detector was kept at 2.1 ms and the time break between the laser pulse and the opening of detector was optimized and set to ~3 μ s.
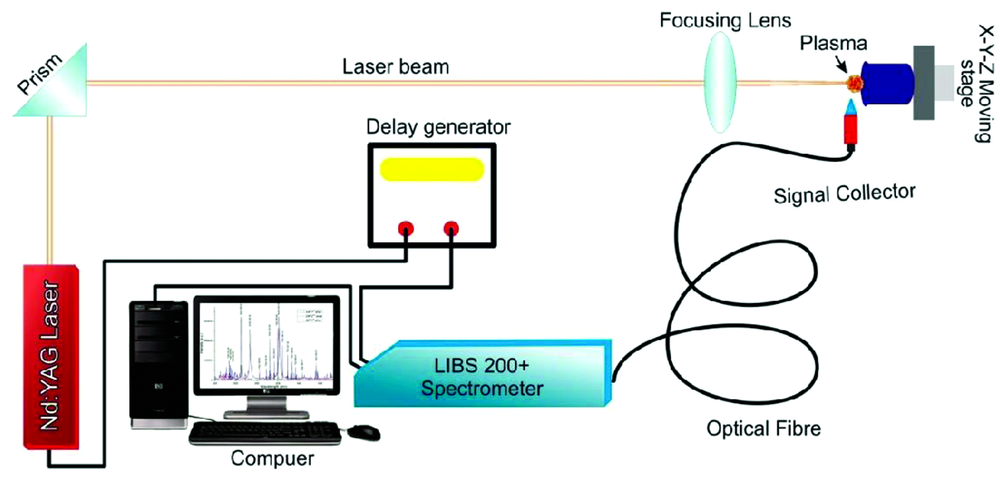 | Fig.1 The experimental layout used in the present study |
The obtained data was displayed in the form of the spectrum using the investigation system software (OOLIBS+, Ocean Optics). All the emissions spectra were acquired utilizing a single laser shot and then taking an average of 20 such spectra to obtain the best signal and noise (S/N) ratio. Every kind of electronic disturbance (like, CCD dark current) is saved independently and subtracted from the acquired spectra earlier to the investigation of samples. The lowest detection limit of LIBS was determined using
where σ stand for the standard departure of the background (noise level), and S stand for the slope of the calibration curve. To calibrate the wavelength scale, a low-pressure Hg- lamp (Ocean optics) was used. From scanning a narrow line width dye laser, the instrumental bandwidth has been calculated to be on the average ~(0.06± 0.01) nm.
The manipulations of LIBS spectra are performed through Origin Pro-08 software program that permits the qualitative as well as quantitative measurements of the elemental constitution of target samples. From a spot diameter of approximately 0.010 2 cm, laser fluence of 40 J· cm-2 was calculated.
For LIBS analysis, the collected samples were first converted into pellets by putting 10 gm of sample in a dye and pressing them by applying a load of 10 tons for 20 min in the dimensions ~4 cm× 6 cm and a thickness of ~2 cm and were pasted on target stand for ablation.
For the analysis of betel leaves via ICP-OES, about 0.5 gm of fine powder sample was dissolved in concentrated HNO3 that was lifted for 24 hr. 10 mm of HClO4 were added and the mixture was heated between 280~300 ℃. During heating, 2 to 3 mL of H2O2 was added in slow rate waiting for a clear solution to obtain. The solution was then filtered and analyzed via ICP/OES (OPTIMA 2100-DV; PerkinElmer, Twofold View).
2 Results and discussion
2.1 Emission Studies
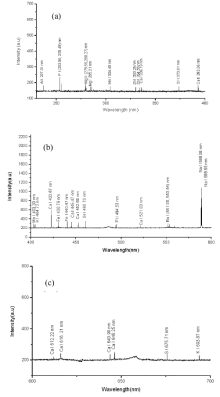
The Plasmas of betel leaves were generated by the first harmonic laser output @1 064 nm of Nd:YAG laser at ambient air environment. The emission spectra were recorded using a multichannel spectrometer from spectral range 200 to 720 nm. The detector was positioned at ≈ 0.5 mm from the sample surface, at an angle of 900 to the expansion of plasma plume direction. In order to get better signal-to-noise ratio the spectral emissions were averaged for 20 laser shots. A typical emission spectrum of sample 1 is exposed in Figure 2.
 | Fig.2(a-c) The typical LIBS spectrum of sample 1 |
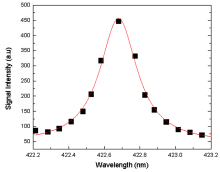
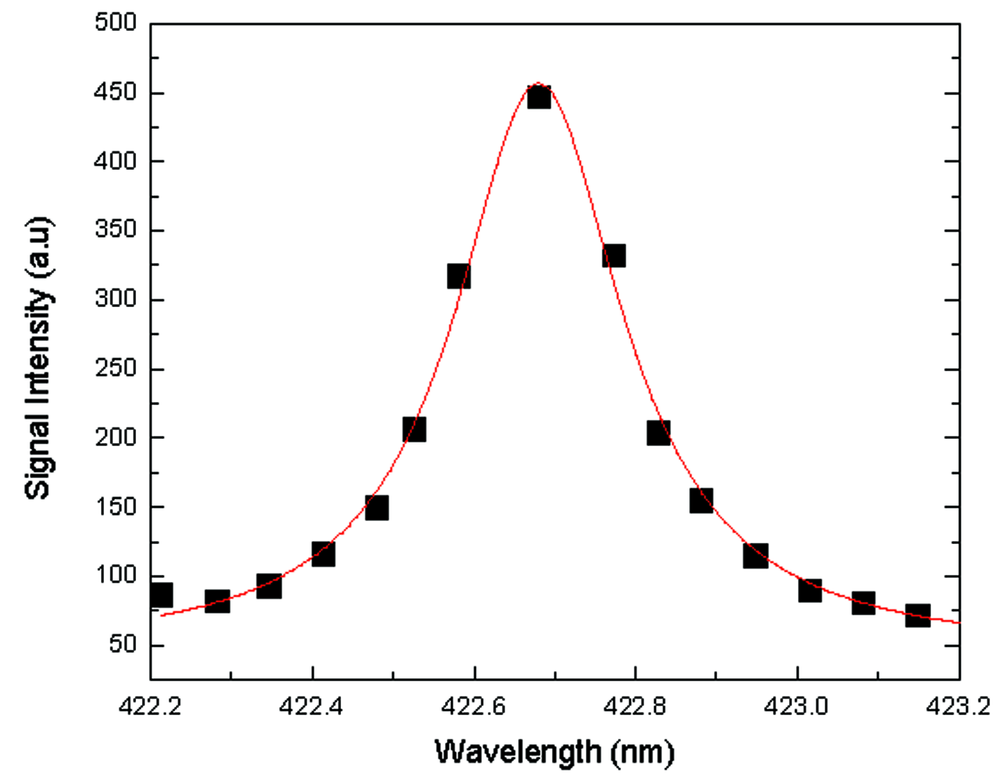 | Fig.3 Lorentzian fitted line profile of Ca Ⅰ at 422.67 nm corresponding to (3p6 4s2 1S0→ 3p64s4p1 |
The spectrum shows well-isolate spectral emission lines with small background field. The spectral emissions lines were recognized via the National Institute of Standards and Technology (NIST) database[26]. The attentive analysis exposed the existence of many neutral/ excited spectral emissions and spectral emission lines conforming different ionized stated corresponding to different elements like aluminium, barium, calcium, copper, magnesium, manganese, sodium, phosphorous, strontium, sulphur, potassium, iron and zinc. Confirmations of our results were done via comparison of LIBS Spectra of target sample with the Spectral emissions of the pure elements employing the same methodology.
2.2 Parameters of Laser induced plasma (electron temperature and electron density)
To study the plasma properties and to perform both quantitative and qualitative analysis, the study of spectral emissions from laser-produced plasma is very significant. The fundamental properties of plasma are electron temperature (Te) and electron number density (Ne). The measurement of plasma parameters is tremendously important to validate the assumption of optically thin plasma (O.T.P.) and the Local Thermodynamic Equilibrium (L.T.E.) which are crucial for the LIBS quantitative analysis. In case, the plasma does not verify the L.T.E. condition, it shows the presence of strong self-absorption and as a consequence, the quantitative analysis of target will be incorrect. Furthermore, the understanding of electron temperature is important to know the process occurring during production of plasma such as atomization, diss-ociation, and excitation etc. It also helps to improve the sensitivity of LIBS. One of the main significant conditions that satisfy that plasma is in the state of L.T.E. is that the collisional process occurring in the qlasma dominates the radiative qrocess. The most frequent criteria used to approximate L.T.E. supposition is the McWhirter criterion. This criteria justifies when the rate of collisional process is dominates over the radiative process as,
where, Te(K) is the electron temperature, Δ E(eV) gives the energy difference of oscillations responsible for spectral emission associated, and Ne(cm-3) shows the electron density.
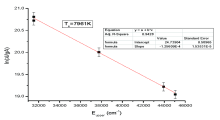
The electron temperature can be approximated using Boltzmann eqn.
where, I stand for the LIBS signal intensity, A(s-1) is transition probability, Ei is the energy of upper level. U gives the partition function, h is plank’ s constant, c gives the speed of light, and Nl is the population density of ground state. The parameters A, g, Ei, and U(T) were obtained from NIST atomic database and Kurucz atomic spectral lines database[27]. By plotting the left side of Eqn. (3) against Ei, the electron temperature can be estimated from the slope of the straight line (-1/kT). Different important conditions must be satisfied such as (1) the separation between wavelengths should be very small to avoid the corrections due to relative response of the detector (2) the energy separation in upper excited levels should be as large as possible to increase the precision and (3) the lines must not be optically thick.
The LTE condition was justified by estimating the electron density (Ne) through the Stark-broadened lines profile for Ca-I spectral line at wavelength 422.67 nm as depicted in Fig.4. The Ne was determined using the relation
where ω gives the “ electron impact parameter” [28]. The measured value of Ne was 1.5× 1018 cm-3.
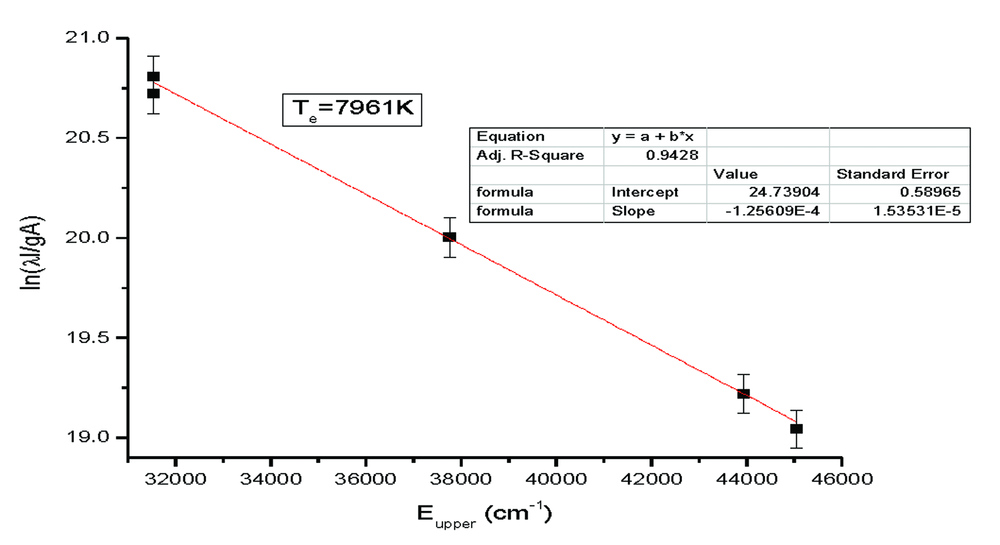 | Fig.4 Typical Boltzmann plot using neutral Ca emission lines from sample 1. The continuous line shows best linear fit |
The plasma temperature estimated by the Boltzmann plot method was (7 961± 250) K. This value of electron temperature used in the mathematical formula for McWhirter’ s criterion along with value of difference of energy between the associated energy levels of respected transition of calcium neutral emission line at wavelength 422.67 nm furnishes the electron number density of about 3.6× 1015 cm-3 that was less than the value determined experimentally and hence shows the agreement of the McWhirter’ s criterion. This implies that plasma was near to L.T.E.
3 LIBS Optimization
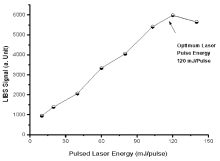
While using LIBS, the time delay between the laser excitation and data acquirement is relatively critical because it plays a major role in the generation of an explicit atomic transition lines with least broadening and over-lapping. After excitation at the early on stage, the electrons and ions are colliding with one another, resulting the broadening and overlapping of atomic and ionic emissions lines[29]. For the intention to reduce this effect and to get considerable spectral transition lines, the time span between the generation and the signal attainment was optimized, so that the peaks of spectral emissions were well resolved without compromising on signal to noise (Signal/Noise) ratio. The laser pulse energy is an essential parameter to be optimized in the LIBS method. The intensity of LIBS signal increases linearly versus laser pulse energy until the earlier get saturated at a critical value of laser pulse energy (see Fig.5). The early linear dependency was due to the increase of ablated material from the material’ s surface due to high pulse energy. The increase of laser energy, also results in the increase of plasma temperature, and above a critical value of laser energy, the free electrons in the hot plasma absorb laser photons this effect is called inverse Bremsstralung effect (IB)[30]. When laser interact with the sample, the ablation is done by leading portion of the laser pulse, and is not dependent of laser energy, whereas the preceding plasma heating is carried out by the remaining part of the laser pulse either during the process of IB or during photo ionization (PI) rather than pairing with the target. The IB effect is strongly wavelength dependent that increases with the wavelength and thus, in our case, as excitation of the emission.
 | Fig.5 LIBS signal intensity against Laser pulse energy for Ca-I 422.67 nm atomic emission line |
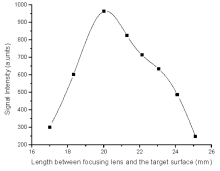
The effects of lens distance on focusing signal intensity was also optimized while performing our experiments as exposed in Fig.6.
 | Fig.6 The effect of lens distance on the intensity of incident signal |
4 Quantitative Analysis
For the estimation of percentage composition of detected elements present in betel leaves samples, three calibration approaches based on LIBS were used i.e., The standard calibration curve method, integrated intensity ratio method, and weight percentage approach. The quantitative measurements of heavy and trace metals present in the betel leaves were carried out by selecting the atomic lines, Al-Ⅰ 237.31 nm, Ca-Ⅰ 643.90 nm, Cu-Ⅰ 521.83 nm, Cr-Ⅰ 425.43 nm, Sr-Ⅰ 460.73 nm, Mg-Ⅰ 285.21 nm, Mn-Ⅰ 403.30 nm, P-Ⅰ 253.56 nm, Fe-Ⅰ 440.47 nm, Zn-Ⅰ 330.25 nm, Ba-Ⅰ 553.54 nm, Na-Ⅰ 588.99 nm, K Ⅰ at 404.72 nm, and S-Ⅱ 373.81 nm. Those particular atomic transition lines were chosen for the reason that they were strongly intense, isolated and well resolved atomic transition lines in the spectral region. In LIBS quantitative investigation, the quantification of different elements in a given sample can be carried out via the intensities of spectral emission line (ionic as well as atomic). Calibration curves were can be constructed based on some set of samples (normally more than three) with different standard concentration of a particular analyte. These curves give a way to approximate the abundance of particular elements in an unknown target. The graph of spectral peak intensities of a specific element against its concentration provides a calibration curve. Calibration curves were drawn for every species via typical samples prepared in known concentration in the betel leaves matrix.
Exposed the calibration curves for quantification of Al, and P from sample 1.
Fig.7(a— b) Typical calibration curves for Al, and P from sample 1. The highest value of R-squared factor shows the best linear fitting
The estimated concentration of detected elements in betel leaves using calibration curves method was tabulated in Table 1 and plotted as in Fig.8 (a— c).
| Table 1 The comparison of LIBS with ICP for different elements detected in betel leaves |
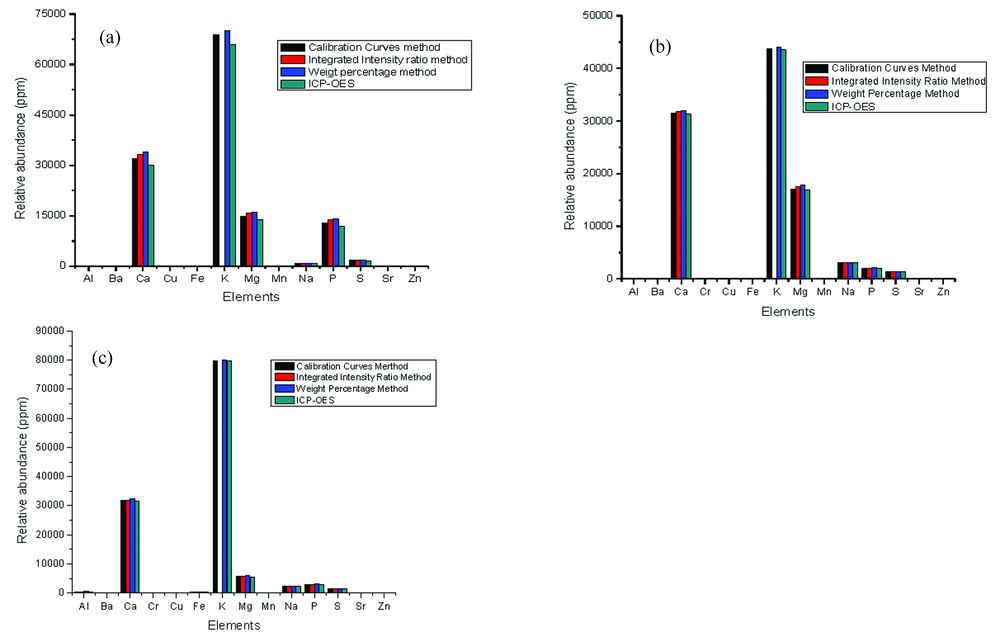 | Fig.8 (a— c) Comparison of concentration of detected elements in sample 1, 2, 3 using three LIBS approaches and ICP-OES |
The second approach used was integrated intensity ratio method. In this methodology, integrated intensity of most abundant line is taken as the reference intensity, and then the relative abundance of unknown element is calculated with respect to the reference intensity. At last take the percentage of the result. The relative concentrations of elements in betel leaves via the integrated intensity ratio method were tabulated in Table 1 and plotted in Fig.8 (a— c).
The third technique was weight percentage approach. In this method, the concentration of an unknown element was calculated with respect to the sum of all intensities of all the elements present in the sample. The relative abundance of elements in betel leaves through the weight percentage method were tabulated in Table 1 and plotted as in Fig.8 (a— c). We confirmed our findings by comparing the concentrations of analyzed elements with more standard analytical technique namely ICP-OES. Elements detected in betel leaves and comparison of concentration detected with LIBS and ICP were exposed in Table 1.
In the present work, ICP-OES was used as a standard analytical tool. Figure 7 (a— c) shows the relative abundance obtained using the calibration curves method gives the results close to that of the ICP-OES analysis.
The studied samples were found to compose of more than13 different elements including 05 are heavy metals (Ba, Cr, Cu, Mn, and Zn). Some of the elements like Al, Ba, Cu, Cr, S, and Zn were higher than the permissible safe limits. For example in sample under analysis, the concentration of Al (89~480) ppm, Ba (29~98.25) ppm, Cu (10~12.5) ppm, Cr (2.5~3.5) ppm, S (1 367~1 791.10) ppm, and Zn (16~23.69) ppm, while the maximum permissible limits set by WHO for these elements are: Al=30 ppm, Ba=2 ppm, Cu=0.000 83 ppm, Cr=1 ppm, S=800 ppm, and Zn=18 ppm respectively. Chromium was not detected in sample 1. Zn was above the permissible safe limit in sample 1 only. The analyzed samples were found to rich of potassium. Other heavy metals like Ni, Ti, Hg, and Pb were below the detectable limits of present experimental setup. The present study shows that the elemental composition of betel leaves collected from various locations varies from sample to sample. The LOD for Cr, Cu, and Zn were found to be 1, 4, and 6 ppm respectively.
5 Conclusions
Spectral characterization of betel leaves was performed by LIBS to measure the elemental composition of heavy and trace metals in the betel leaves sample. Elements like Al, Ba, Ca, Cr, Cu, Fe, K, Mg, Mn, Na, P, S, Sr, and Zn were confirmed in betel leaves from Pakistan. The comparative study of LIBS with ICP-OES showed that using the calibration curves method yielded the closest outcomes to the values provided by ICP-OES. The detection system was optimized in terms of laser energy and focusing lens distance from target surface. Analytical measurements were carried out under the LTE assumption. We calibrated our detection system for all of the detected elements. The heavy metals like Ba, Cr, Cu and Zn were found above the permissible safe limits. The results of LIBS were cross validated by comparing the results with the results of a more standard analytical technique of ICP-OES and were found in good harmony. Furthermore, Limit of detection (LOD) of LIBS setup was also determined for Cr, Cu, and Zn.
The authors have declared that no competing interests exist.
参考文献
| [1] |
|
| [2] |
|
| [3] |
|
| [4] |
|
| [5] |
|
| [6] |
|
| [7] |
|
| [8] |
|
| [9] |
|
| [10] |
|
| [11] |
|
| [12] |
|
| [13] |
|
| [14] |
|
| [15] |
|
| [16] |
|
| [17] |
|
| [18] |
|
| [19] |
|
| [20] |
|
| [21] |
|
| [22] |
|
| [23] |
|
| [24] |
|
| [25] |
|
| [26] |
|
| [27] |
|
| [28] |
|
| [29] |
|
| [30] |
|