


激光拉曼光谱法测定天然气组成标准研究
[朱华东1, 2  , 周理
, 周理1, 2 , 常宏岗1, 2 , 孙晓艳1, 2 ]
, 周理|
|


进行了天然气组成分析-激光拉曼光谱法标准化研究, 探讨了激光拉曼天然气组成分析方法标准化的可行性。 采用激光拉曼光谱进行天然气组成分析, 无需将天然气中各组分分离便可实现多组分同步检测, 减少分析时长, 提高测量的实时性, 实现快速分析, 通过国内外激光拉曼天然气分析方法和标准的研究和实验, 掌握了国内外激光拉曼天然气分析方法技术现状及发展方向, 积累了激光拉曼天然气分析试验数据, 结果表明激光拉曼天然气分析具有可快速检测(10 s)、 连续记录和操作简单的优点, 适用于天然气录井、 井站、 集气站原料气气质分析和天然气净化处理中过程控制中实时快速获取气质数据, 建议制定激光拉曼光谱天然气分析方法标准, 测量组分为CO2, N2, H2S, CH4, C2H6, C3H8, 测量范围分别为: CH4: 75%~99.9%, C2H6: 0.005%~20%, C3H8: 0.005%~10%, H2S: 0.001 5%~10%, N2: 0.02%~10%, CO2: 0.01%~10%(上述浓度均为摩尔分数), 为上游领域天然气勘探开发及过程控制服务。
Biography: ZHU Hua-dong, (1983—), an engineer and doctor, Research Institute of Natural Gas Technology, PetroChina Southwest Oil & Gasfield Company e-mail: zhu_hd@petrochina.com.cn
In this paper, the standardization of natural gas composition analysis by Laser Raman Spectroscopy was studied, and the feasibility of Standardization was discussed. When using Laser Raman spectroscopy, multiple components can be measured simultaneously without separating every component, so it can save analyzing time, improve real-time effect and realize fast analysis. In addition, the technical status and developing trend for natural gas analytical method by Laser Raman through domestic and international standardized investigation were studied, and data of natural gas analysis experiments by Laser Raman were accumulated. The results show that Laser Raman spectrum will be a powerful tool for real time rapid access to gas quality data in natural gas logging, wells station, gas quality analysis of gas gathering station and natural gas purification process control due to the advantages of fast test (10 seconds), continuous record as well as simple operation. It is suggested to work on standards of natural gas analysis method by Laser-Raman to test CO2, N2, H2S, CH4, C2H6 and C3H8, and the testing ranges are CH4 is from 75% to 99.9%, C2H6 0.005%~20%, C3H8 0.005%~10%, H2S 0.001 5%~10%, N2 0.02%~10% and CO2 from 0.01% to 10%(mole fractions), offering service in the upstream area for natural gas composition monitoring to improve exploration and development.
The content of carbon dioxide, hydrogen sulfied and hydrocarbon component related to calorific power in natural gas are important to weigh its quality. Currently, the main analyzing method for natural gas in our country is gas chromatographic method with standards of GB/T 13610, GB/T 27894.4, GB/T 27894.5 and GB/T 27894.6. It needs carrier gas and some chromatographic columns to conduct separating test, which needs more than ten minutes or tens of minutes, even the quickest with 100 seconds to 5 minutes. In recent years, Laser Raman scattering technique was developed for testing most components in natural gas with the advantages of fast test (10 seconds), continuous record and simple operation. That can be used as standard method of analyzing natural gas composition is a useful complement to gas chromatographic to rich natural gas composition measurement method.
The current method for testing natural gas composition is gas chromatographic method (GCM). Due to different analyzing purposes, there are several options when analyzing natural gas composition. The mainly analyzed routine items are nitrogen, carbon dioxide, methane to pentane and sometimes helium, hydrogen and C6+. For associated gas or oil field gas, sometimes it is needed to test the content of C5 or higher carbon number HC, which is called extended analysis. This standard consists of two series seen in table 1, one is series standard of ISO, such as ISO6974 (including 6 parts), the other is ASTM D1945 and GPA2261 of ASTM.
| Table 1 Standards of natural gas composition analysis |
The GB/T 13610 of our standard is non-equivalent ASTM D1945. It set the rules of testing natural gas or similar gas composition with GCM. When GCM is in operation, it needs continuous and stable high purity carrier gas with many chromatographic columns and detectors to conduct complex separating detection, so, it needs a long time (more than ten or tens of minutes) to analyze HC, nitrogen, carbon dioxide and hydrogen composition, even the quickest on-line chromatography needs 100 seconds to 5 minutes for a completely natural gas composition analysis. In addition, the lower limit when using GCM to test hydrogen sulfied is 0.3% (mole fraction), so GCM is not used to test HC composition and content of hydrogen sulfide simultaneously. In China, quality test, assessment and control of natural gas often need combination of GCM, iodometry and cooling mirror hygrometer method with multiple instruments and equipment. What’ s more, the costing time, energy, and the cost are high.
Laser Raman spectroscopy is a kind of scattered spectroscopy, matter with different chemical structure has different Raman shift, and intensity of Raman peak is proportional to its concentration, so when using this technique to test natural gas quality and multiple components (including sulfuretted hydrogen and other acid gas), we don not need to separate every component in natural gas, it can reduce analyzing time, improve real-time and realize fast analysis. This technique can be used in composition analysis of natural gas in studies[1, 2, 3, 4, 5, 6, 7, 8, 9, 10, 11, 12, 13]. At present, the representative technique and instrument, analyzer of Atmosphere Recovery Inc (ARI), is based on US patent 4784486[6] and China patent for invention (ZL201410584402.0). Among them, Laser Raman gas analyzer in RLGA series of ARI has been commercialized with a certain scale, which is commonly used in industrial process and environmental monitoring of metallurgy, petrochemical, chemical industry, natural gas, energy and aerospace. It is used to analyze marsh gas composition in Sunnyside Biogas Digester, Madison, USA; a Laser Raman analyzer installed on natural gas pipeline network of Emerald Park is used to analyze on-line natural gas composition; it has also been used in Southwest Oil and Gas Field Branch of CNPC, Shanxi Yanchang Petroleum LLC and Zhongyuan Oilfield Puguang branch of Sinopec. By now, only ASTM issued to use ASTM D7940— 2014 Standard Practice for Analysis of Liquefied Natural Gas (LNG) by Fiber-Coupled Raman Spectroscopy in 2014, this standard use Laser Raman to test LNG composition and analyze liquid sample.
The current representative Laser Raman natural analyzing technique is Laser Raman natural analyzing technique developed by 《Development and Application of Laser Raman Gas Analyzer》 of national major scientific instrument and equipment development special project of China in 2012 and united states patent (US patent 4784486). Because technique of national special project is not fully mature and the domestic equipment based on it has not been entered the market, the real tests of natural gas by Laser Raman are based on US patent 4784486. From the results of instrument 1 (RLGA-4800)[10](seen in table 2 and 3), it shows that the measurements are in line with the indicated value of standard gas for the selected measuring components of CH4, C2H6, C3H8, nC4H10, iC4H10 and H2S under their range limits. The analyzed result is reliable. The RSD of 6 continuous testing results is from 0.02% to 1.66%, the range as repeatability is showed by xmax-xmin is from 0 to 0.04%(mole fraction).
| Table 2 Reliability of instrument 1 |
| Table 3 Reliability and repeatability of Instrument 1(Mole fraction/%) |
Instrument 2(RLGA-2811)was used to conduct test analysis for completely studying natural gas composition analyzing method by Laser Raman spectroscopy, its principle and performance are in line with instrument 1(RLGA-4800)[10], the difference is that the tested components of CH4, C2H6, C3H8, nC4H10, iC4H10 and H2S are replaced with CH4, C2H6, C3H8, CO2, N2, H2S, H2O and C4+. On the basis of testing range of Laser Raman gas analyzer, standard natural gases with different concentrations are used to make indicated value of standard gas by GCM. According to manual, turn on the analyzer, preheat the instrument for 10 minutes, adjusting the flow at 275 mL· min-1, the pressure at 84.64 kPa and the temperature at (25± 0.5) ℃. First, use high-purity argon to set zero, and calibrate with standard gas; then, it’ s time to test, select 16 bottles of standard gas that have similar component and content with real natural gas as sample to conduct test, on basis of instrument characteristic, the tested eight components are CH4, C2H6, C3H8, CO2, N2, H2S, H2O and C4+, H2O is not calibrated and studied due to the lack of standards. The results are summarized in table 4 to 9 on basis of original data, which shows that for every tested component, the lowest limit of detection are as follows: C2H6, 0.005%(Mole fraction); C3H8, 0.003%(Mole fraction); H2S, 15 ppm; N2, 0.023%(Mole fraction); CO2, 0.008 5%(Mole fraction). For the main composition of natural gas is methane, it is not needed to study the lowest limit of detection of methane. The consistency between the tested results and the indication of standard gas GC calibrated value is as follows. The relative error of CH4 and C3H8 results is less than 1%, which shows good match with GC; when the concentration of C2H6, CO2, N2 and H2S is less than 0.1%, the relative error of their results are high between 3% and 22%, while their absolute error is under the acceptable range. As a whole, the tested results are in line with the indication of standard gas, the analyzed results are reliable. The repeatability of CH4 and C3H8 show good calculated whether by RSD or the absolute deviation of two consecutive measurements, the RSD of their 11 tested results is more than 1%(1%~26%) when concentration of C2H6, CO2, N2 and H2S is less than 0.1%; Under low concentration and industry practice, the repeatability should be expressed by difference of two continuous tested results, the experimental result showed that xmax-xmin of 11 tested results (Xmax-Xmin is more than deviation of the two continuously tested values) are all under the acceptable limit. In short, Laser Raman spectroscopy can have good repeatability.
| Table 4 Experimental results of C |
| Table 5 Experimental results of C2H6 using instrument 2 |
| Table 6 Experimental results of C3 |
| Table 7 Experimental results of H2Susing instrument 2 |
| Table 8 Experimental results of |
| Table 9 Experimental results of C |
Based on the above experimental results and afetr analyzing the datum, we make the following conclusions:
(1) The tested composition by Laser Raman spectroscopy consists of CO2, N2, H2S, CH4, C2H6, C3H8, nC4H10 and iC4H10.
(2) Range of every component concentration in natural gas tested by Laser Raman spectroscopy is as follows. Methane is from 1% to 99.9%, C2H6 0.005 2% to 18.47%, C3H8 0.002 7% to 9.22%, H2S 0.001 5% to 9.12%, N2 0.023% to 9.24%, CO2 0.008 5% to 9.39%, nC4H10 0.520% to 0.984% and iC4H10 0.515% to 1.51%(the above concentration are all mole fraction).
(3) Repeatability of experimental results
The total 71 repeatable data obtained from every concentration point of all components in the above experiments is summarized as follows.
① There are 7 repeatable datum with concentrations less than 0.01%(mole fraction) as figure 1, the difference between the two tested results is less than 0.003.
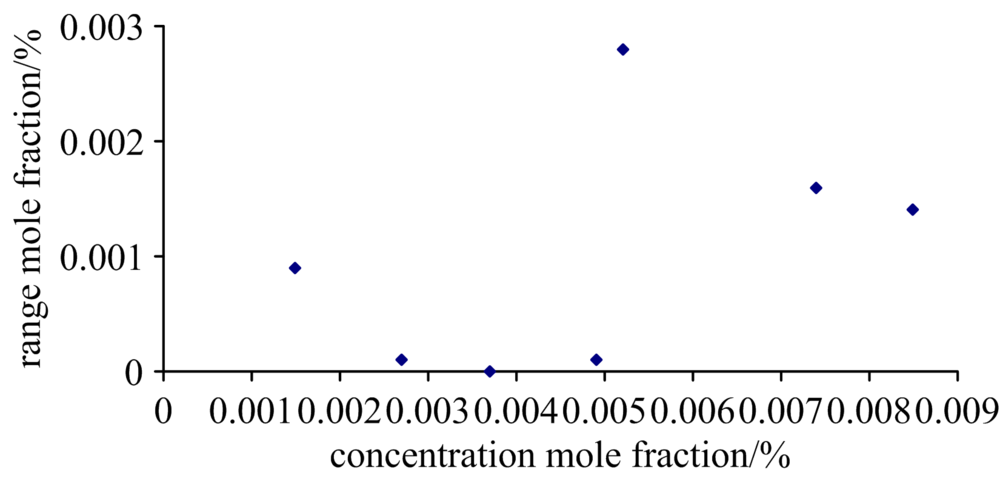 | Fig.1 Repeatability statistics with concentrations less than 0.01% (mole fraction) |
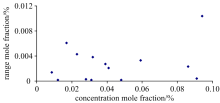
② There are 14 repeatable datum with concentrations between 0.01% and 0.1%(mole fraction)as figure 2, the difference between the two tested results is less than 0.01.
 | Fig.2 Repeatability statistics with concentration between 0.01% and 0.1% (mole fraction) |
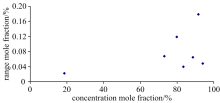
③ There are 18 repeatable datum with concentrations between 0.1% and 1%(mole fraction)as figure 3, the difference between the two tested results is less than 0.02.
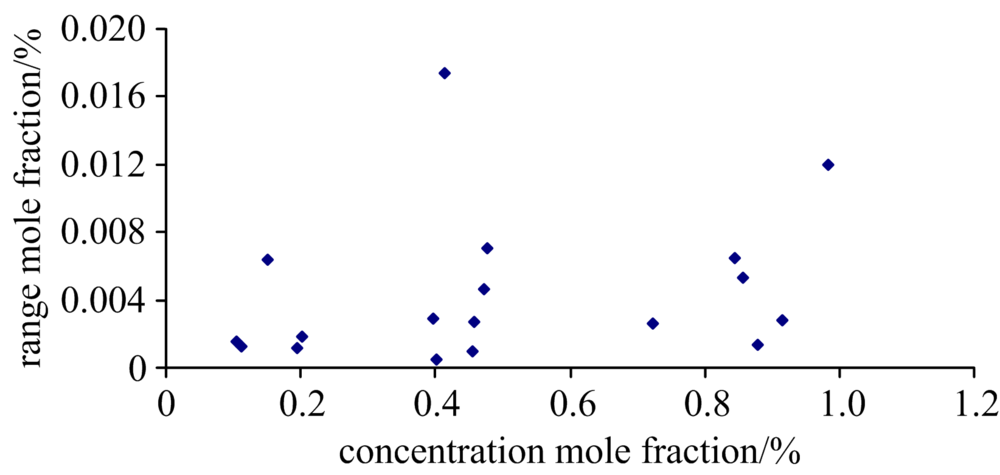 | Fig.3 Repeatability statistics with concentration between 0.1% and 1% (mole fraction) |
④ There are 18 repeatable datum with concentrations between 1% and 10%(mole fraction)as figure 4, the difference between the two tested results is less than 0.04.
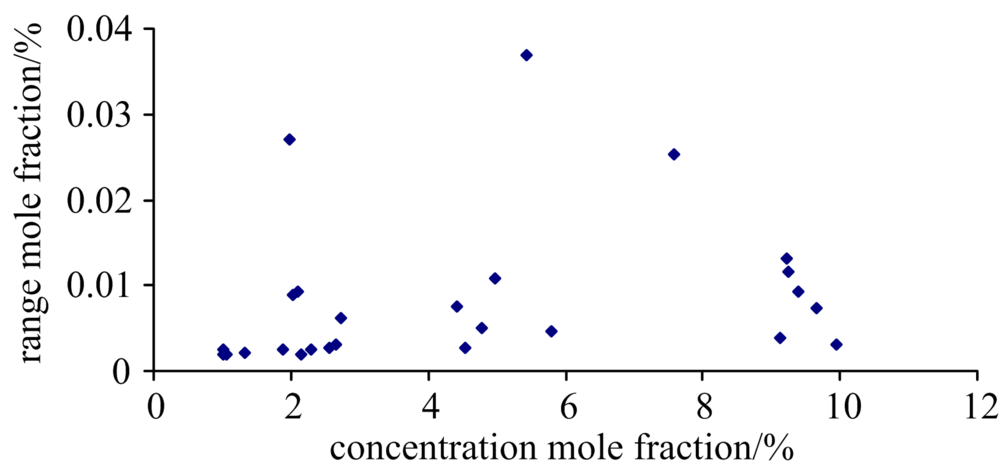 | Fig.4 Repeatability statistics with concentration between 1% and 10% (mole fraction) |
⑤ There are 7 repeatable datum with concentrations more than 10%(mole fraction)as figure 5, the difference between the two tested results is less than 0.2.
Based on figure 1 to figure 5, obtain repeatability of natural gas analysis by Laser Raman as table 10.
 | Fig.5 Repeatability statistics for concentrations greater than 10% (mole fraction) |
| Table 10 Repeatability of gas analysis by Laser Raman (mole fraction/%) |
| Table 11 Comparison of Raman spectroscopy, gas chromatography and iodometry in measuring product gas from purification plant Ⅰ |
| Table 12 Comparison of Raman spectroscopy, gas chromatography and iodometry in measuring product gas from purification plant Ⅱ |
| Table 13 Comparison of Raman spectroscopy, gas chromatography and iodometry in measuring raw gas from a well |
* Get content of H2S by iodometry
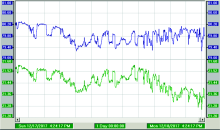
By using instrument 2 to continuously test content of nitrogen and oxygen in the air for the purpose of studying repeatability of continuous operation by this method, 8640 groups of data of nitrogen content in 24 hours (figure 6, interval: 10 seconds) were obtained. It is found that the tested nitrogen content is between 79.30% and 80.30%, oxygen is between 21.55% and 21.30%, and the respective repeatability error is 0.63% and 0.58%. So, there is a good repeatability when the method is in continuous operation.
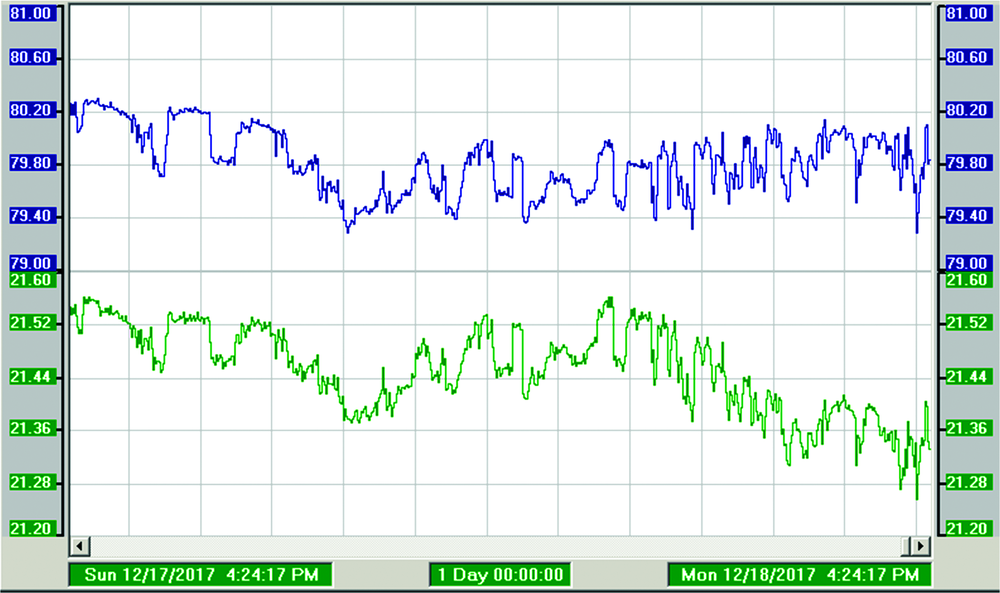 | Fig.6 Result fluctuation of nitrogen and oxygen in the air for 1 day measured by instrument 2 |
Use instrument 2 to analyze bottled natural gas sample got from the site, analyze one wellhead gas and product gases of two purification plant (Purification plant Ⅰ and Ⅱ ), compare them with GCM and iodometry, the results are seen in table 11 to table 13. It can be seen from the results that the analyzed results by Laser Raman, GCM and iodometry are in line with each other when concentration of real natural gas is more than 0.05%, and the repeatability meets the requirements of industry. When the concentration is less than 0.05%, the max relative error of analyzed results by Laser Raman, GCM and iodometry is up to 14%, the RSD of 11 continuous tested results is up to 9.49%. If using absolute error and absolute deviation of two tested values to study reliability and repeatability of this method, the result is acceptable.
(1) To sum up, analyzing technique by Laser Raman has improved a lot by now with an advantage of fast test (10 seconds), continuous record and simple operation which is suitable for rapid access to data of gas quality in the control process of analyzing raw gas quality for natural gas logging, well stations and gas-gathering station, as well as purifying natural gas. It is suggested to make standards of analyzing method by Laser Raman in order to offer service for the upstream area of exploration and development of natural gas and its process control.
(2) There has not been a standard about natural gas analysis by Laser Raman at home and abroad, and there is only ASTM D7940-2014 issued by ASTM for testing LNG components.
(3) It is suggested that the limited tested components in analysis standard of natural gas composition by Laser-Raman spectroscopy consist of CO2, N2, H2S, CH4, C2H6, C3H8, nC4H10 and iC4H10, the tested range is that methane is from 1% to 99.9%, C2H6 0.005% to 20%, C3H8 0.005% to 10%, H2S 0.001 5% to 10%, N2 0.02% to 10%, CO2 0.01% to 10%, nC4H10 0.5% to 2% and iC4H10 0.5% to 2%(the above concentrations are all mole fraction), the repeatability is given from precision in part according to concentration, referring to table 10.
The authors have declared that no competing interests exist.
| [1] |
|
| [2] |
|
| [3] |
|
| [4] |
|
| [5] |
|
| [6] |
|
| [7] |
|
| [8] |
|
| [9] |
|
| [10] |
|
| [11] |
|
| [12] |
|
| [13] |
|