


液相射流中中Al元素单双脉冲LIBS研究
[王莉1, 2 , 徐丽1, 2 , 徐卫青1 , 姚关心2 , 郑先锋2 , 崔执凤2, *  ]
]
]
|
|


为了综合比较单双脉冲激光诱导击穿光谱技术(LIBS)在液体中重金属元素的检测效果, 利用自建的液相射流单-双脉冲LIBS技术装置, 对AlCl3水溶液中的Al元素LIBS特性进行测量和分析。 实验中使用两台532 nm Nd:YAG激光器作为激发光源, 等离子体辐射信号通过光谱仪和ICCD进行采集。 实验研究了单脉冲下Al(396.15 nm)发射谱线的谱线强度随激光能量、 ICCD门延时、 门宽之间的变化关系, 获得了最优化实验参数激光能量为50 mJ, ICCD门延迟为1 200 ns, 门宽为150 ns。 在相同的实验条件下, 实验考察了Al(369.15 nm)发射谱线的谱线强度随双脉冲之间的延时, 激光总能量, ICCD门延时的变化关系, 获得了最优化实验参数为两双脉冲之间的延时为1 000 ns, 激光总能量为50 mJ, ICCD门延时为1 100 ns。 单脉冲和双脉冲条件下获得重金属Al的LIBS检测限分别为26.79和10.80 ppm, 双脉冲LIBS技术使元素检测限下降2倍多。 实验结果表明双脉冲可以提升LIBS技术的探测灵敏度, 为LIBS技术应用于水体中重金属快速检测提供了依据。
A homemade experimental setup of laser-induced breakdown spectroscopy (LIBS) with aqueous jets was used to compare the detection results of dual-pulse (DP-LIBS) and single-pulse laser-induced breakdown spectroscopy (SP-LIBS) for heavy metal elements in liquids. Two Q-switched Nd:YAG lasers that operated at 532 nm were utilized to generate plasma on the AlCl3 aqueous jets. The plasma emission signal was detected by spectrometer with an intensified charge-coupled device (ICCD). The effects of laser-pulse energy, ICCD gate width, and ICCD gate delay on the intensity of the Al spectral line at 396.15 nm were presented for SP-LIBS. Experimental results showed the optimum parameters for laser energy, ICCD gate width, and gate delay were 50 mJ, 150 ns, 1 200 ns, respectively. The influence of experimental parameters, including interpulse delay, total pulse energy, and ICCD gate delay on the signal enhancement of the Al 396.15 nm spectral line intensity was investigated and optimized. Results showed that the optimal parameters for interpulse delay, total pulse energy, and ICCD gate delay were 1 000 ns, 50 mJ, 1 100 ns respectively. The detection limits of Al were 26.79 and 10.80 ppm by SP-LIBS and DP-LIBS, respectively. The results indicated that DP-LIBS can improve the detection sensitivity which offers a feasible basis for the detection of metallic elements in liquid.
Laser-induced breakdown spectroscopy (LIBS) is an analytical technique that measures the emission spectral lines of elements from plasma produced via the laser ablation of the sample. In recent years, LIBS has been used to quantitatively analyze trace metal elements in liquids and has provided a reproducible means to analyze various kinds of metal elements in liquid droplets or jets[1, 2, 3], aerosols, and static liquids[4, 5, 6, 7, 8]. When the laser beam is focused on a static liquid surface, however, the fluctuation of the liquid surface by laser sputtering produces poor signal repeatability. When the laser beam is focused into the liquid, the bubbles that are produced by the thermal effect of the plasma exert a scattering effect on the incident laser beam and the plasma emission, thus decreasing the detection sensitivity of the LIBS signal. Liquid droplets are more difficult to control and quantify given their uneven sizes; thus, liquid droplets may hamper the optical detection of spectral lines[9]. The liquid-to-solid conversion and ion-exchange concentrator techniques have been adopted to improve the limit of detection (LOD)[10, 11, 12]. Compared with bulk liquid measurements, the LIBS measurements of liquid jet have better detection limits. Although the LIBS of liquid jets can prevent splashing, single-pulse laser-induced breakdown spectroscopy (SP-LIBS) suffers from relatively low detection sensitivity. Given that a dual-phase configuration improves LIBS sensitivity[7, 13, 14, 15] in the quantitative analysis of metal element in liquids, we combined the liquid jet and dual-pulse configuration to detect trace metals in aqueous solutions.
The present work investigated the LIBS of Al in AlCl3 liquid jets with single- and double-nanosecond pulse LIBS schemes. We studied the influence of ICCD gate delay and laser pulse energy on the signal properties of Al in LIBS. Moreover, we obtained the detection limits for Al element under optimum experimental conditions for SP-LIBS. Based on SP-LIBS measurements, we obtained the dual-pulse laser-induced breakdown spectroscopy (DP-LIBS) for interpulse delays in the range of 600~1 400 ns for AlCl3 liquid jets. The detection limit of Al element of the dual-pulse scheme was also determined.
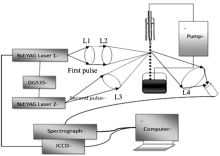
The schematic of the experimental set-up is shown in Fig.1. Dual-pulse experiments were conducted using two 532 nm laser radiation sources (LAB-170-10, Spectra-Physics, USA) with a pulse duration of 10 ns and a repetition rate of 10 Hz. The laser energy was varied with a series of identical transmission meshes. Both laser beams were focused on the surface of the liquid jets, which were generated by a homemade nozzle that had a 0.5 mm inner diameter and a 15° cross angle. The liquid was circulated with a peristaltic pump. The liquid flow was tunable and the flow rate was set prior to the experiments. The jet included a nitrogen stream to prevent droplets from splashing and polluting the surfaces of the focal and collection lens. A 120 mm quartz lens was used to focus the ablation laser beam to produce plasma at the surface of the liquid jet. A 200 mm quartz lens was used to focus the second laser beam on the center of the plasma that was produced by the ablation laser. In DP-LIBS, the two laser pulse energies were adjusted to half of that in SP-LIBS. The interpulse delay time was controlled by DG535(SRS), a programmable pulse generator.
 | Fig.1 Schematic of the experimental setup for the double-pulse experiments |
Plasma emission was collected by a lens with a 10 cm focal length and coupled to a 50 μ m diameter optical fiber with a 50 mm focal length lens at a 90° angle to the ablative laser beam. The fiber introduced light into a 0.75 m imaging spectrograph (Acton, SP2758) that was equipped with 1 200 lines· mm-1 diffraction gratings. An ICCD detector (Princeton Instruments, ICCD, PIMAX 1024), which was fitted to the spectrograph, measured time-resolved atomic emission from plasma. Spectral acquisition was triggered by a synchronization signal from the laser. The spectral range of the spectrometer was 200~800 nm with a spectral resolution of λ /Δ λ =5 000. The dark current background of the ICCD detector was subtracted from the measured spectroscopic data for each measurement.
In this study, the measured emission spectral line was fitted using a Lorentzian function and the line intensity was obtained by integrating the simulated line profile. To reduce signal fluctuations that were produced by the random pulse energies of the laser, the acquired spectra were averaged over 10 individual experiments. In turn, each individual experiment was averaged over 15 laser shots. All experimental parameters, such as ICCD integration time, gate delay, gate width, gain, and detection range were controlled by a computer. The gate width, integration time, and gain of ICCD were optimized and fixed at 150 ns, 1.8 μ s, and 80 respectively. AlCl3 (purity 99.999%) was purchased from Alfa Aesar (USA) and used without further processing. Sample solutions with different concentrations were prepared with distilled water.
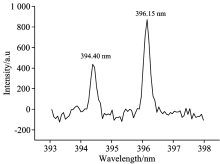
Figure 2 shows the obtained LIBS of AlCl3 liquid jet in the range of 393~398 nm with a pulse energy of 50 mJ, ICCD gate delay of 1600 ns, and Al concentration of 150 ppm under SP-LIBS. The spectrum exhibited two emission lines that corresponded to 394.40 and 396.15 nm spectral lines that arose from the 3s23p→ 3s24s transitions, respectively, of the Al atom.
 | Fig.2 LIBS spectra of Al in the range of 393~398 nm |
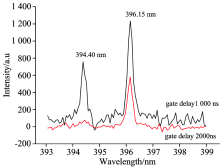
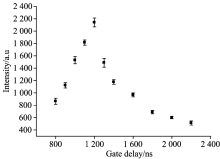
The LIBS signal was measured with different ICCD gate delays, 50 mJ laser pulse energy, and 250 ppm Al. The temporal evolution of the Al emission lines is shown in Fig.3 and Fig.4. Figure 3 shows the LIBS spectra of Al in the range of 393~396 nm at (a) 1 000 ns gate delay and (b) 2 000 ns gate delay. Figure 4 shows the temporal evolution of the Al(Ⅰ ) emission line at 396.15 nm. The spectral line intensity differed with different gate delay. The spectral line intensity at 394.40 nm was lower than that at 396.15 nm and disappeared when the gate delay exceeded 2 000 ns because the former had a higher excitation potential. The integrated intensity of Al spectral line at 396.15 nm increased when gate delay ranged from 800 to 1 200 ns but decreased when gate delay exceeded 1 200 ns. Hence, the optimum gate delay is 1 200 ns.
 | Fig.3 LIBS spectra of Al in the range of 393~399 nm with (a) 1 000 ns gate delay and (b) 2 000 ns gate delay |
 | Fig.4 Temporal evolution of the emission spectral line of Al(Ⅰ ) at 396.15 nm |
At early stages, plasma emission involves a strong continuum background from free electron recombination (free-bound emission) and bremsstrahlung radiation (free-free emission). The emission lines of neutral atoms and ions broaden as a result of collisions between free electrons and atoms (Stark effect). When the ICCD gate delay was prolonged, the continuum emission decayed rapidly because of plasma expansion and cooling. The background emission became negligible and atomic emission lines sharpened when the gate delay exceeded 800 ns.
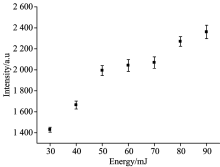
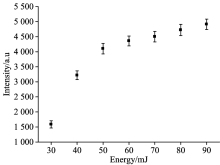
The influence of pulse laser energy on LIBS signal intensity was also studied. The integrated intensity of the Al(Ⅰ ) 396.15 nm line at different pulse energies are shown in Fig.5 with a gate delay of 1 200 ns and 250 ppm Al. Line intensity increased when pulse energy ranged from 30 to 90 mJ. However, when pulse energy exceeded 50 mJ, the increase in line intensity became negligible and the reproducibility of the LIBS signal worsened because of the splashing of the liquid jet. Therefore, the optimum laser pulse energy is 50 mJ.
 | Fig.5 Integrated intensity of the emission spectral line of Al(Ⅰ ) at 396.15 nm with different laser pulse energies |
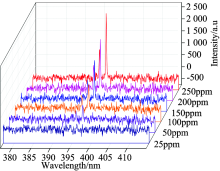
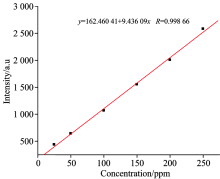
Figure 6 shows the line intensity with Al concentrations of 25 to 250 ppm, pulse energy of 50 mJ, and gate delay of 1 200 ns. The emission spectral line was undetectable when Al concentration was lower than 25 ppm. Figure 7 shows the calibration curve of the emission signal versus Al concentration. In the calibration curve, the line intensity of Al is linearly dependent on analyte concentration, thus allowing the determination of the LOD with the formula
 | Fig.6 Emission spectral line of Al(Ⅰ ) at 394.40 and 396.15 nm with different Al concentrations |
 | Fig.7 Calibration curve of the Al emission spectral line at 396.15 nm in SP-LIBS |
where σ B is the standard deviation (RSD) of the background and S is the slope of the calibration line, a linear fit of the experimental data yields S=9.36, σ B=83.60, and LOD=26.79 ppm.
Figure 8 shows the SP-LIBS and DP-LIBS signal of the Al liquid jet in the range of 393~400 nm with 250 ppm Al. In the DP-LIBS experiment, the interpulse delay time was 1 000 ns and the single pulse energy was 25 mJ, which was exactly half of the pulse energy used in the SP-LIBS experiment. The gate width of ICCD was set to 150 ns and the gate delay of ICCD was 1100 ns relative to the ablation laser pulse in both cases. Compared with SP-LIBS, DP-LIBS, two fold enhancement in DP-LIBS could be achieved under optimum experimental conditions.
 | Fig.8 LIBS signal of Al in the range of 393~400 nm for SP-LIBS and DP-LIBS |
We investigated the influence of the interpulse delay Δ t on DP-LIBS with a fixed gate delay of 1 100 ns. Figure 9(a) shows the enhancement factor, which is defined as the intensity ratio of DP-LIBS and SP-LIBS at equal total energies. Three characteristic temporal intervals were distinguishable in the inter-pulse delay region of 600~1 400 ns. The signal enhancement factor and the emission line intensity increased at the 600~1 000 ns range of the inter-pulse delay. The maximum enhancement facuor reached the maximum value at approximately 1 000 ns. The S/N was 30. As shown in Figure9.a, the enhancement factor decreased in the third temporal intervals. The optimum interpulse delay was 1 000 ns in our DP-LIBS experiments.
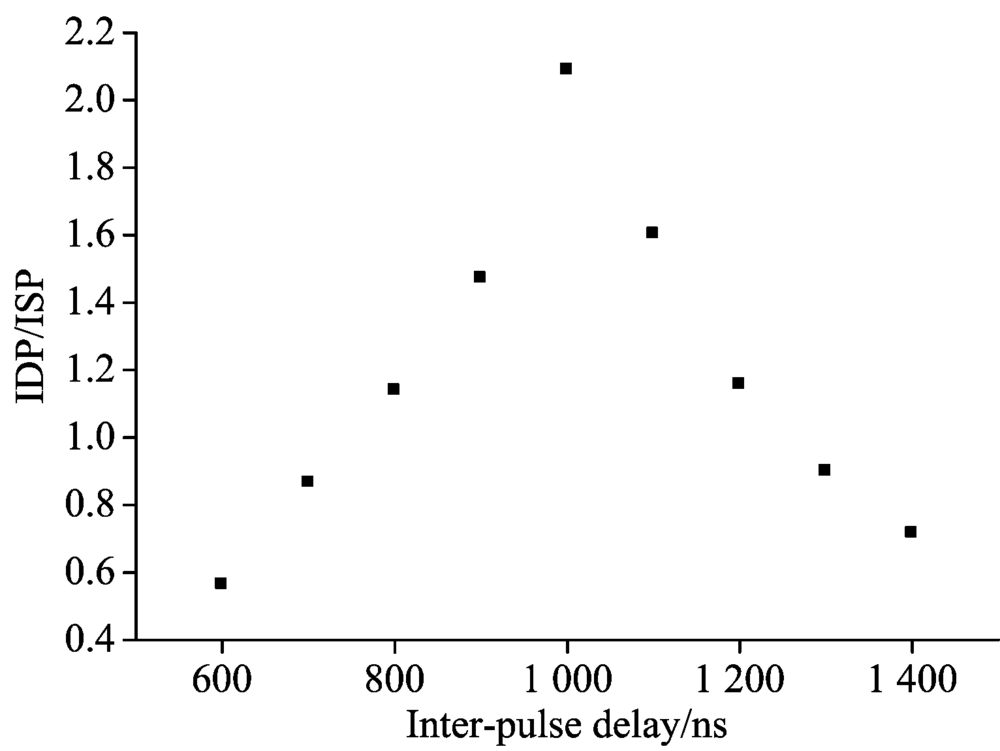 | Fig.9 (a) Signal enhancement of the emission spectral line of Al(Ⅰ ) at 396.15 nm as a function of inter-pulse delay |
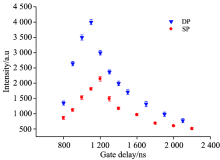
 | Fig.9 (b) Temporal evolution of integrated emission intensity versus gate delay for the emission spectral line of Al(Ⅰ ) at 396.15 nm |
To explore the signal enhancement mechanism of DP-LIBS, we measured the DP- and SP-LIBS signal line intensities of the emission spectral line of Al at 396.15 nm with a total pulse energy of 50 mJ, Al concentration of 250 ppm, and different gate delays. In the DP-LIBS scheme, the gate delay was relative to the first laser and the inter-pulse delay was fixed at an optimum value of 1 000 ns. The results are shown in Fig.9(b). The SP-LIBS and DP-LIBS signal intensities reached their maximum values at time delays of approximately 1 200 and 1 100 ns, respectively. Figure 9(a) shows that the optimum inter-pulse delay is 1 000 ns. These results demon-strated the following process, which was presented in Fig.9(b): (1) From 600 to 1 000 ns, the intensity of DP-LIBS signal continually improves compared with that of the SP-LIBS signal and reaches a maximum at 1 100 ns. This likely resulted not only from the effect of the second pulse laser in inducing the plasma of the liquid jet, but also from strong interaction with the plasma that was produced by the ablative pulse laser. The strongest interaction and the maximum signal enhancement were achieved at 1 100 ns. (2) From 1 100 to 2 100 ns, the signal enhancement gradually decreases from the weakening interaction with plasma.
Our DP-LIBS experiment revealed that the laser pulse energy influences the intensity of the Al emission spectral line. Under the optimum parameters, we measured the line intensity at different total pulse energies in the range of 30~90 mJ with 250 ppm Al. The result, which is illustrated in Fig.10, showed that line intensity increases with increasing total pulse energy. However, the relative standard deviation and S/N of the Al line intensity drastically worsened with the RSD value of 6.046% and S/N value of 35 when the pulse energy exceeded 50 mJ. Hence, the optimum pulse energy used to determine the detection limit is 50 mJ.
 | Fig.10 Intensity of the emission spectral line of Al(Ⅰ ) at 396.15 nm with different total laser pulse energies |
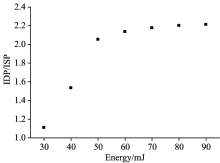
We calculated the signal enhancement factor from the DP-LIBS and SP-LIBS signal intensities under optimum conditions at different total pulse energies and 250 ppm Al, as shown in Fig.11. The maximum signal enhancement factor was more than twofold and almost remained constant when the pulse energy exceeds 50 mJ.
 | Fig.11 Signal enhancement of the emission spectral line of Al(Ⅰ ) at 396.15 nm as a function of the total laser pulse energy |
To determine the DP-LIBS detection limit of Al in the liquid jet based on the Al 396.15 nm spectral line, we measured line intensities at different Al concentrations under the optimum experimental parameter as shown in Fig.12. The LIBS signal was still distinguishable when Al concentration decreased to 10 ppm with the S/N value of 3.
 | Fig.12 Spectral line intensity of Al(Ⅰ ) at 394.40 nm and at 396.15 nm with different Al concentrations in DP-LIBS |
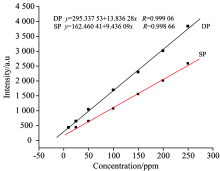
Calibration curves were generated based on the measured spectral line intensities. The intensities were measured via DP-LIBS and SP-LIBS cases under optimum parameters and are shown in Fig.13. Figure 13 indicates that the intensity is nearly linearly dependent on Al concentration. Based on this relationship, LOD can be determined with the 3σ B formula given by the International Union of Pure and Applied Chemistry
 | Fig.13 Calibration curves of the emission spectral line of Al(Ⅰ ) at 396.15 nm in SP-LIBS and DP-LIBS |
In the DP-LIBS experiment, a linear fit of the experimental data yielded S=13.84, σ B=49.81, and LOD=10.80 ppm. This LOD value is almost less than half of the value obtained in the SP-LIBS experiment at the same total pulse energy.
For the first time, DP-LIBS is applied to sensitively detect Al in AlCl3 liquid jets. Based on the measured SP-LIBS signal, the influences of laser pulse energy, ICCD gate delay, and interpulse delay on enhancing the intensity of the characteristic emission spectral line of Al(Ⅰ ) at 396.15 nm were investigated in a closed laminar liquid jet system. For SP-LIBs, the optimum values of the laser pulse energy and ICCD gate delay are 50 mJ and 1 200 ns, respectively, and the LOD of the Al emission line is 26.79 ppm. The DP-LIBS signal is enhanced compared with the SP-LIBS signal at the same total pulse energy. For DP-LIBS, the optimum values of the total laser pulse energy, inter-pulse delay, and ICCD gate delay relative to the second laser pulse are 50 mJ, 1 200 ns, and 1 100 ns, respectively. Under these conditions, the LIBS signal of Al is enhanced by two-fold. The LOD of the Al emission line is 10.8 ppm, which is lower than the half of that in SP-LIBS.
The authors have declared that no competing interests exist.
| [1] |
|
| [2] |
|
| [3] |
|
| [4] |
|
| [5] |
|
| [6] |
|
| [7] |
|
| [8] |
|
| [9] |
|
| [10] |
|
| [11] |
|
| [12] |
|
| [13] |
|
| [14] |
|
| [15] |
|