


Tm3+/Ho3+掺杂碲酸盐玻璃的上转换发光性能与能量转换机制
[陈敢新1 , 成运1, *  , 钱奇
, 钱奇2 ]
, 钱奇|
|


采用高温熔融法制备了单掺Tm3+和Tm3+/Ho3+共掺碲酸盐玻璃, 测试了808 nm激光泵浦下玻璃的红外和上转换荧光光谱。 Tm3+/Ho3+共掺碲酸盐玻璃上转换荧光光谱主要由695 nm红光、 544 nm绿光、 474 nm蓝光和740 nm红光四个发光带组成。 通过分析样品的光谱性能和能量转换机制, 发现很少报道的740 nm红光可能是由Tm3+:1 D2 →3 F2, 3能级跃迁产生的。 在掺杂0.5 mol% Tm2O3的样品中添加0.3 mol% Ho2O3, 695 nm红光、 740 nm红光和474 nm蓝光等上转换发光强度明显增大, 大约分别是单掺0.5 mol% Tm2O3样品中发光强度的3倍, 2.5倍和14倍。 这些情况说明存在着强烈的Ho3+→Tm3+反向能量传递。 单掺Tm3+碲酸盐玻璃中1 D2能级(发射740 nm红光)上的粒子集居主要来源于合作上转换(CU)过程, 而3 F2, 3能级(发射695 nm红光)上的粒子集居除了来源于CU过程之外, 还有740 nm红光的发射和1 G4能级上部分粒子的无辐射跃迁(1 G4→3 F2, 3)两条途径, 因此样品中695 nm红光强度明显要大于740 nm红光强度。 通过交叉驰豫作用CR2和CR3以及反向共振能量转移RET2, Tm3+/Ho3+共掺碲酸盐玻璃中Tm3+的1 G4能级(发射474 nm蓝光)上的粒子集居数比单掺Tm3+时出现了净增加。 Tm3+的1 G4能级上粒子集居数的增加可能进一步强化了该能级的无辐射跃迁、 740 nm红光的发射以及CU过程, 并进而促使Tm3+的3 F2, 3能级上的粒子集居。 所以, 当Tm3+/Ho3+共掺碲酸盐玻璃与单掺Tm3+碲酸盐玻璃中掺杂相同浓度的Tm3+时, 前者的红光和蓝光等上转换荧光强度均比后者要大。 本文还研究了Tm3+之间以及Tm3+与 Ho3+之间的交叉弛豫和能量传递等效应, 并进一步探讨了Tm3+与 Ho3+之间的能量转换机制。
The Tm3+ single-doped and Tm3+/Ho3+ co-doped tellurite glasses are prepared by traditional melt quenching technique. The synthesized glasses were characterized with infrared and up-conversion fluorescence spectra has been investigated in terms of the excitation of 808 nm laser, and the up-conversion fluorescence composed of four emission bands centering around 695, 544, 474 and 740 nm wavelengths, respectively. The 740 nm emission band seldom reported is possibly assigned to the Tm3+:1 D2→3 F2, 3 transition by analyzing the spectra properties of the glass samples and relevant energy transfer mechanism. The intensities of 740, 695 and 474 nm emission in the tellurite glass at the concentration of 0.5 mol% of Tm2O3 and 0.3 mol% of Ho2O3 are almost 3, 2.5 and 14 times larger than those in the tellurite glass at the concentration of 0.5 mol% of Tm2O3, respectively. These obviously indicate that there is backward energy transfer from Ho3+ to Tm3+. The population for the energy level1 D2 (emitting 740 nm red) of Tm3+ in Tm3+ single-doped tellurite glass is significantly originated from cooperative up-conversion (CU). However, the population for the energy level3 F2, 3 (emitting 695 nm red) of Tm3+ is not only resulted from the process of CU, but also from the1 D2→3 F2, 3 transition and the relaxation of the level1 G4 of Tm3+. Hence, the intensity of 695 nm emission is evidently higher than that of 740 nm emission in the samples. Because of the cross relaxation CR2 and CR3, as well as backward resonant energy transfer RET2, there is a net increase of population for the level1 G4 (emitting 474 nm blue) of Tm3+ in the Tm3+/Ho3+ co-doped tellurite glass compared to the Tm3+ single-doped tellurite glass while the two glasses are conformed with the concentration of Tm3+. The net increase of population for the level1 G4 of Tm3+ is possible to reinforce the multi-phonon relaxation process of this level, emission of 740 nm red light, as well as CU process, and further enhance the population for the level3 F2, 3 of Tm3+. Therefore, the intensities of red and blue fluorescence in the Tm3+/Ho3+ co-doped tellurite glass are clearly greater than those in the Tm3+ single-doped tellurite glass. The effects of cross relaxation and energy transfer between Tm3+ and Ho3+ are studied, while the energy transfer mechanism between Tm3+ and Ho3+ is also further discussed in the work.
Rare-earth (RE) doped tellurite glass materials provide potentials for photonic application in color displays, solid-state lighting, up-conversion (UC) optic fiber laser, eye-safe laser radar, the monitoring of atmospheric pollutions, and laser medicine surgery[1, 2, 3, 4, 5, 6]. Recently, Tm3+/Ho3+ co-doped tellurite glasses capable of easy preparation technology, low cost, and good resistance to corrosion have turned into a hot topic of research in the field of exploring the generation of efficient up-conversion white light sources and mid-infrared laser materials[5, 6, 7, 8]. The cross relaxation between Tm3+ and Ho3+ enhances the emitting of red and green fluorescence in the generation of efficient white light sources[7]. The backward Ho3+→ Tm3+ energy transfer and up-conversion emission in the Tm3+/Ho3+ co-doped tellurite glasses have attracted considerable attention, meanwhile, the Tm3+ ion acting as a sensitizer leads to an enhanced Ho3+ ion UC luminescence[1, 9]. The 740 nm red emission owing to the 1D2→ 3F2, 3 transition of Tm3+ ion and the mechanism enhancing Tm3+ ion UC luminescence due to the backward Ho3+→ Tm3+ energy transfer have seldom been reported, although various up-conversion mechanism and relevant parameters are presented for the Tm3+/Ho3+ co-doped materials[9, 10].
In this paper, the Tm3+ single-doped and Tm3+/Ho3+ co-doped tellurite glasses are prepared by traditional melt quenching technique from the raw materials TeO2, WO3, ZnO, Tm2O3 and Ho2O3, which were all used as high purity reagents. The infrared and up-conversion emission spectra of the glasses under the excitation of 808 nm laser were tested. The spectra are analyzed, while the energy transfer mechanism between Tm3+ and Ho3+ is further studied in the Tm3+/Ho3+ co-doped tellurite glasses.
TeO2-based glasses with the molar compositions of (99.7-x)(70TeO2-20WO3-10ZnO)-xTm2O3-0.3Ho2O3(x=0.1, 0.3 and 0.7), and(99.5-y)(70TeO2-20WO3-10ZnO)-0.5Tm2O3-yHo2O3 (y=0 and 0.3) were prepared by using reagent-grade TeO2 (99.99%), WO3 (99.99%), ZnO (99.99%), Ho2O3 (99.99%) and Tm2O3 (99.99%). Batch materials of 15 g were mixed and melted at about 850 ℃ within 20 minutes with a platinum crucible. Melts were thermally quenched by casting the melt into a preheated stainless steel mold, and then annealed at a temperature close to the vitreous transition temperature for three hours before ramping down to room temperature. All the obtained samples were cut into specimens of 10 mm× 10 mm× 2 mm and optically polished for the measurement of the absorption and emission spectra.
Absorption spectra of rare-earth doped samples were determined with a Perkin-Elmer-Lambda 900/UV/VIS/NIR spectrophotometer in the spectral range of 400~2 300 nm at room temperature. The up-conversion fluorescence spectra in the range of 400~770 nm and the infrared fluorescence spectra in the range of 1 300~2 200 nm were obtained by using a computer-controlled TRIAX 320 fluorescence spectrometer (Jobin-Yvnon Corp.) with a 808 nm LD as pump source.
Figure 1 shows the up-conversion fluorescence spectra of the Tm3+ single-doped and Tm3+/Ho3+ co-doped tellurite glasses in the range of 400~770 nm under excitation of 808 nm LD at the room temperature. The up-conversion fluorescence is composed of four emission bands centering around 695, 544, 474 and 740 nm wavelengths, respectively. Only red and weak blue fluorescence are observed in Tm3+ single-doped tellurite glasses, however we can clearly identify green luminescence besides red and blue fluorescence in Tm3+/Ho3+ co-doped tellurite glasses. Moreover, the intensities of red and blue fluorescence are all at once increased with the growth of the concentration of Tm2O3, and then draw back with the concentration of Tm2O3 doping up to 0.5 mol%. There is no obvious regularity for the dependence of 544 nm green light fluorescence intensity on the concentration of Tm2O3. The fluorescence intensities of 740, 695 and 474 nm emission in the tellurite glass at the concentration of 0.5 mol% of Tm2O3 and 0.3 mol% of Ho2O3 are almost 3, 2.5 and 14 times larger than those in the tellurite glass at the concentration of 0.5 mol% of Tm2O3, respectively. These indicate that there is an intense backward energy transfer from Ho3+ to Tm3+ which enhances the fluorescence emission of Tm3+.
 | Fig.1 The up-conversion fluorescence spectra of the (99.7-x)(70TeO2-20WO3-10ZnO)-xTm2O3-0.3Ho2O3(x=0.1, 0.3 and 0.7), and(99.5-y)(70TeO2-20WO3-10ZnO)-0.5Tm2O3-yHo2O3 (y=0 and 0.3) tellurite glasses upon excitation at 808 nm LD |
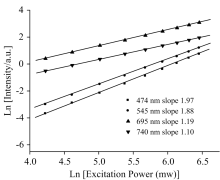
In order to identify the excitation mechanisms, the fluorescence spectra were recorded at different input laser powers (P) and the intensity (I) of various up-conversion fluorescence peaks were measured. A plot of logI versus logP is shown in Fig.2. One finds that the slopes of n for the emission at 474, 544, 695 and 740 nm have values of 1.97, 1.88, 1.19 and 1.10, respectively. All the emissions are verified to follow the two incident laser photons law. According to the energy matching conditions and the dependence of up-conversion emission intensity on excitation power, the possible up-conversion mechanisms for the emission bands discussed are based on the simplified energy levels of Tm3+ and Ho3+ presented in Figure 3.
 | Fig.2 Logarithmic plot of laser power (P) versus up-conversion intensity (I) of 740 nm red, 695 nm red, 544 nm green and 474 nm blue light emission bands of sample observed for 808 nm excitation |
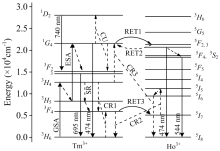
 | Fig.3 Energy level diagram for Tm3+ and Ho3+ showing the pumping scheme and energy transfer mechanisms |
The three up-conversion emission bands centered at 695, 544 and 474 nm have attributed to the transitions Tm3+: 3F2, 3→ 3H6, Ho3+: 5S2→ 5I8, as well as Ho3+: 5F2, 3→ 5I8 and Tm3+: 1G4→ 3H6, respectively. The 740 nm emission and its origination have seldom been reported. The three possible passages significantly enhancing 740 nm emission are shown as follows: Firstly, the 740 nm emission originates from energy transition of Ho3+. The 740 nm red emission should be assigned to the 5S2→ 5I7 transition of Ho3+ ion, although there is no corresponding absorb band near at the 750 nm wavelength in Ho3+:ZnWO4 crystal[10]. Figure 4 shows the emission spectra of the Tm3+:Ho3+ co-doped glass samples plus the curve for the pure Tm3+ doped glass sample with the same Tm3+ concentration. The spectra have been normalized with respect to the 695 nm peak. It can be clearly discovered that the relative intensity of the 740 nm peak decreases linearly with increasing Ho3+ concentration. On the other hand, figure 1 shows that the intensity of the 740 nm peak growths with increasing Tm3+ concentration while the Ho3+ concentration is fixed. These cases indicate that the major reason of enhancing 740 nm emission is not induced by the energy level transition of Ho3+. Perhaps stark split of energy level is another reason. The energy difference between 695 nm and 740 nm emission is about 900 cm-1 which approaches to a phonon energy of matrix. The stark split of energy level 3F2, 3 of Tm3+ maybe lead 740 nm emission by releasing a phonon energy to matrix. However, the shape of spectrum should not be transformed. The third possible reason is that 695 and 740 nm emissions are originated from different energy levels transition of Tm3+, respectively. The energy difference between energy levels 1D2 and 3F2, 3 of Tm3+ is about 13 500 cm-1 which matches with 740 nm emission. Hence, we conclude that 740 nm emission would be likely to be assigned to the 1D2→ 3F2, 3 transition of Tm3+.
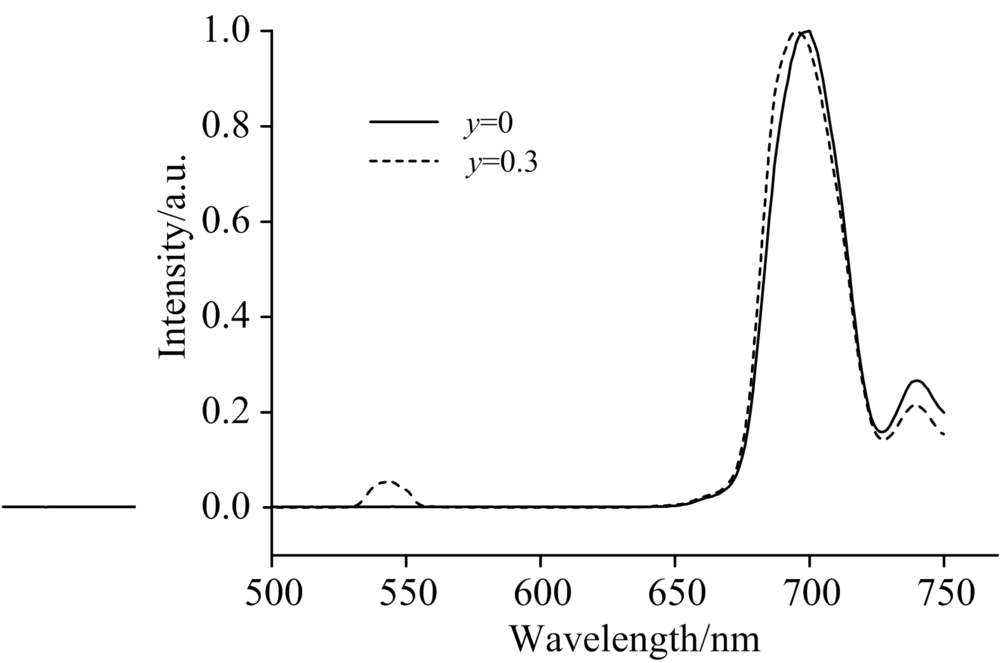 | Fig.4 Fluorescence spectra for the (99.5-y)(70TeO2-20WO3-10ZnO)-0.5Tm2O3-yHo2O3(y=0 and 0.3) temlurite glasses normalied with respect to the 695 nm peak of Tm3+ |
The main up-conversion processes in pure Tm3+ doped tellurite glasses are as follow[11, 12, 13]:
GSA:Tm3+: 3H6+hν 0→ Tm3+: 3H4 (1)
ESA:Tm3+: 3H5+hν 0→ Tm3+: 1G4 (2)
CU: Tm3+: 1G4+Tm3+: 1G4→ Tm3+: 3F2, 3+Tm3+: 1D2 (3)
With the input laser radiation of 808 nm, Tm3+ populated at the ground state 3H6 is initially excited to the 3H4 level by absorbing a photon (GSA). The excited Tm3+ in the 3H4 level relaxes to 3F5 state through multi-phonon relaxation process and then absorbs a second photon to the 1G4 level (ESA). Tm3+ ions store energy on the 1G4 level and then return back to the ground state (3H6), resulting in an emission at 474 nm. Energy difference between 1G4 and 1D2 levels is almost the same as between 1G4 and 3F2, 3 levels for Tm3+. No such energy coincidence is seen for energy levels in Tm3+. It is possible that there is a cooperation up-conversion process (CU). A pair of Tm3+ ions, both being in the 1G4 level, cooperatively transfers their excitation energy to each other. One is deexcited to the 3F2, 3 level while the other is promoted to the 1D2 level. Tm3+ populated at the 1D2 level radiate to the 3F2, 3 level with yielding 740 nm red light. The 695 nm up-conversion emission process can be described as follow: The increase of population for the 3F2, 3 level is not only caused by the process that Tm3+ at 1G4 level decay rapidly to the 3F2 meta-stable state and further relax to 3F3 level through multi-phonon relaxation, but also created by the CU process and 740 nm emission. Tm3+ ions are transferred from 3F2, 3 level to 3H6 level, emitting red light at 474 nm. As can be seen from above, Tm3+ populated at the 1D2 level (740 nm emission ) is mainly originated from the CU process while Tm3+ populated at the 3F2, 3 level (695 nm emission) can be obtained from the other two passages besides the CU process. Therefore, the intensity of 695 nm emission is stronger than that of 740 nm emission.
The following notations were also adopted for the energy transfer processes investigated in pure Tm3+ doped tellurite glass:
CR1: Tm3+: 3H4+Tm3+: 3H6→ Tm3+: 3F4+Tm3+: 3F4 (4)
SR: Tm3+: 3H4→ Tm3+: 3H5+hν (5)
Because the energy difference between 3F4 and 3H4 levels better matches that between 3F4 and 3H6 levels for Tm3+, Tm3+ at 3H4 level decay rapidly to the 3F4 meta-stable state via cross relaxation (CR1) process while the Tm3+ at 3H6 level are raised to 3F4 level. As a result, the population accumulated at 3F4 level of Tm3+ gets more densely, and a much stronger luminescence of the 3F4 level of Tm3+ at 1.8 μ m can be expected (see Fig.5). Tm3+ at 3H4 level can be transferred to3H5 level via spontaneous radiation (SR) process, and further relax to3F4 level through multi-phonon relaxation process. These processes would result in that a strong emission at 1.47 μ m is occurred and Tm3+ at 3H4 level is heavily populated.
 | Fig.5 Emission spectra for pure Tm3+ doped bulk glass samples upon excitation at 808 nm LD |
There is no emission band at around 544 nm in the pure Tm3+ doped tellurite glass, However, the novel emission at 544 nm is clearly observed in Tm3+/Ho3+ co-doped tellurite glasses although Ho3+ ion has no absorption band at around 808 nm[6, 14]. These indicate that the 544 nm emission of Ho3+ can only caused by energy transfer (ET) of Tm3+ to Ho3+ ion. The possible ET processes are as follows[12, 15]:
RET1:Tm3+: 1G4+ Ho3+: 5I8→ Ho3+: 5F2, 3+Tm3+: 3H6 (6)
RET3: Tm3+: 3F4+ Ho3+: 5I8→ Tm3+: 3H6+Ho3+: 5I7 (7)
CR2: Tm3+: 3F4+Ho3+: 5I7→ Tm3+: 3H6+Ho3+: 5I5 (8)
From Figure 3, it can be observed that the energy of the 1G4 and 3H5 levels on the Tm3+ ion approach the energy of the 5F2, 3 and 5I6 levels on the Ho3+ ion, respectively. Hence, in Tm3+/Ho3+ co-doped tellurite glasses, most likely two resonant energy transfer (RET) mechanisms work. In the first mechanism (RET1) the excited Tm3+ ions are transferred from 1G4 level to 3H6 level with releasing energy. Ho3+ ions absorb the energy and then are excited from 5I8 level to 5F2, 3 level. Similarly, another pathway for resonant energy transfer (RET3) from Tm3+ to Ho3+ ions may be as follow: the excited Tm3+ ions are transferred from 3H5 level to 3H6 level and then the Ho3+ ions at 5I8 level are excited to 5I6 level. The energy difference between 3F4 and 3H6 levels of Tm3+ well matches that between 5I5 and 5I7 levels of Ho3+, Tm3+ at 3H4 level decay rapidly to the 3H6 level via cross relaxation (CR2) process while the Ho3+ at 5I7 level are raised to 5I5 level[13]. Ho3+ at 5I5 level can be transferred non-radiatively to 5I6 level by the multiphonon relaxation process.
The intensities of 695, 740 and 474 nm emission in the Tm3+/Ho3+ co-doped tellurite glass are larger than those in the pure Tm3+ doped tellurite glass, respectively, when the glasses samples are all doped at the concentration of 0.5 mol% of Tm2O3 (see Fig.1). These indicate that there is an intense backward energy transfer from Ho3+ to Tm3+ which enhances the fluorescence emission of Tm3+. The backward energy transfer from Ho3+ to Tm3+ is mainly in two ways:
RET2: Ho3+: 5F2, 3+Tm3+: 3H6→ Tm3+: 1G4+Ho3+: 5I8 (9)
CR3: Ho3+: 5I6+Tm3+: 3H4→ Tm3+: 1G4+Ho3+: 5I8 (10)
Firstly, the backward resonant energy transfer (RET2) from Ho3+ to Tm3+ is possibly taken place when the forward RET1 occurs. Ho3+ at the 5F2, 3 level could be transferred to the 5I8 level and then the Tm3+ at the 3H6 level are excited to the 1G4 level. Another backward energy transfer channel is the cross relaxation (CR3) process because the energy difference between 5I6 and 5I8 levels in the Ho3+ matches very well that between 1G4 and 3H4 levels in the Tm3+. Since Ho3+ ion has no absorption band at around 808 nm, the population of 5F2, 3 level at the Ho3+ should be originated from the forward energy transfer from Tm3+ to Ho3+. Therefore, the speed of forward energy transfer from Tm3+ to Ho3+must be larger than that of backward energy transfer from Ho3+ to Tm3+. The intensities of the up-conversion fluorescence peaks of Tm3+ should significantly decrease with increasing Ho3+ concentration. On the contrary, the intensities of up-conversion fluorescence peaks become stronger with increasing Ho3+ concentration (see Fig.1). These indicate that there are other backward energy transfer pathways enhancing emission of the 1G4 level at Tm3+ besides RET2 process. According the aforementioned, the population of the 1G4 level at Tm3+ is also reinforced by the cross relaxation process CR2 and CR3. Because of the cross relaxation CR2 and CR3, as well as backward resonant energy transfer RET2, there is a net increase of electron population for the level 1G4 of Tm3+ in the Tm3+/Ho3+ co-doped tellurite glass compared to the Tm3+ single-doped tellurite glass while the two glasses are conformed with the concentration of Tm3+. The net increase of population for the level 1G4 of Tm3+ is possible to reinforce the multi-phonon relaxation process of this level, emission of 740 nm red light, as well as CU process, and further enhance the population for the level 3F2, 3 of Tm3+. Therefore, the intensities of red and blue fluorescence in the Tm3+/Ho3+ co-doped tellurite glass are clearly greater than those in the Tm3+ single-doped tellurite glass (see Fig.1).
The four up-conversion emission bands centered at 740, 695, 544 and 474 nm are found to attribute to the transitions Tm3+: 1D2→ 3F2, 3, Tm3+: 3F2, 3→ 3H6, Ho3+: 5S2→ 5I8, as well as Ho3+: 5F2, 3→ 5I8 and Tm3+: 1G4→ 3H6, respectively. The population for the energy level 1D2 (emitting 740 nm red) of Tm3+ in Tm3+ single-doped tellurite glass is largely originated from cooperative up-conversion (CU). However, the population for the energy level 3F2, 3 (emitting 695 nm red) of Tm3+ is not only resulted from the process of CU, but also from the 1D2→ 3F2, 3 transition and the relaxation of the level 1G4 of Tm3+. Hence, the intensity of 695 nm emission is evidently higher than that of 740 nm emission in the samples. Because of the interaction of the cross relaxation CR2 and CR3, CU process, as well as backward resonant energy transfer RET2, the population for the levels 1G4 and 3F2, 3 of Tm3+ in the Tm3+/Ho3+ co-doped tellurite glass can be heavily enhanced. Therefore, the intensities of red and blue fluorescence in the Tm3+/Ho3+ co-doped tellurite glass are clearly greater than those in the Tm3+ single-doped tellurite glass while the two glasses are conformed with the concentration of Tm3+.
The authors have declared that no competing interests exist.
| [1] |
|
| [2] |
|
| [3] |
|
| [4] |
|
| [5] |
|
| [6] |
|
| [7] |
|
| [8] |
|
| [9] |
|
| [10] |
|
| [11] |
|
| [12] |
|
| [13] |
|
| [14] |
|
| [15] |
|